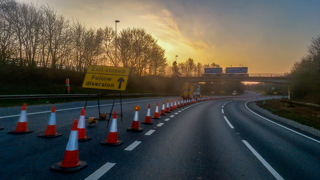
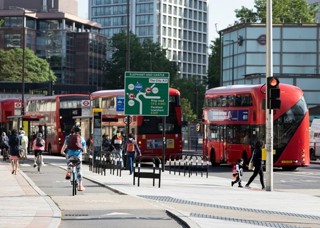
Drivers in London sat idle in traffic for 82 hours last year – 10 more hours than 2012, making it the most congested UK city and the second worst in Europe, according to a new report.
Traffic congestion was up in nine of the 18 UK cities analysed by traffic information and driver services provider INRIX.
Based on the amount of hours wasted last year in traffic, the UK’s 10 worst metropolitan areas for driving were:
|
Rank |
UK Metropolitan Area |
Hours Wasted in 2013 |
Change from 2012 (in hours) |
|
1 |
London commute zone |
82 |
10 |
|
2 |
Gr. Manchester |
46 |
2 |
|
3 |
Merseyside |
39 |
2 |
|
4 |
S. Nottinghamshire |
39 |
4 |
|
5 |
Gr. Birmingham |
33 |
1 |
|
6 |
Gr. Belfast |
31 |
1 |
|
7 |
S. Yorkshire |
26 |
-1 |
|
8 |
Leeds-Bradford |
25 |
2 |
|
9 |
Avon & N. Somerset |
24 |
0 |
|
10 |
Portsmouth-Fareham |
24 |
-1 |
Traffic congestion across Europe increased approximately 6% in the last three-quarters of the year.
In the UK, drivers wasted approximately 30 hours in traffic congestion in 2013, one more hour than 2012.
Overall, motorists in the UK spent less time in traffic than fellow drivers in Belgium, Netherlands, France, Germany and Luxembourg and approximately 30 fewer hours than travellers in Europe’s worst country for traffic, Belgium.
“So goes traffic, so goes the economy,” said Bryan Mistele, president and CEO, INRIX. “While bad news for drivers, increases in traffic congestion in Europe are signs of a slowly recovering economy.”
The UK economy grew 1.9% in 2013 – its strongest growth since 2007. Unemployment fell steadily throughout the year contributing to the increase in UK traffic congestion as more people headed back to work.
For the first time, the INRIX Traffic Scorecard this year identifies the worst roads for traffic in the UK and other countries worldwide.
Based on total annual hours of delay in the worst peak period (either morning or evening), the UK’s 10 Worst Roads for Traffic last year were:
|
Rank |
Metropolitan Area |
Road(s) |
Between |
And |
Distance (miles) |
Worst Peak Period (am /pm) |
Total Delay per Year (hours) |
|
1 |
London |
A4 |
Central London |
The M4 |
14.2 |
pm |
91 |
|
2 |
London |
A4 |
The M4 |
Central London |
14.7 |
pm |
73 |
|
3 |
London |
A215 |
Camberwell |
Croydon turn off |
9.55 |
pm |
67 |
|
4 |
London |
A217 |
Morden |
Chelsea |
10.4 |
pm |
67 |
|
5 |
London |
A1/A1(M) |
Finchley |
Barbican |
8.43 |
pm |
66 |
|
6 |
London |
A23 |
Croydon |
Westminster Bridge Road |
8.62 |
pm |
63 |
|
7 |
London |
A205 |
Catford |
Woolwich Ferry |
6.86 |
pm |
60 |
|
8 |
London |
A41 |
Central London |
M1 |
7.54 |
pm |
52 |
|
9 |
London |
A12 |
Stratford |
M25 |
13.6 |
pm |
50 |
|
10 |
London |
A406 |
Chiswick Roundabout |
Neasden Junction |
5.88 |
pm |
48 |
Worst roads outside of London
|
Rank |
Metropolitan Area |
Road(s) |
Between |
And |
Distance (miles) |
Worst Peak Period (am /pm) |
Total Delay per Year (hours) |
|
1 |
Birmingham |
M6 |
J10 Wolverhampton East |
J7 Birmingham (North) |
10.22 |
am |
36 |
|
2 |
Edinburgh |
A8 |
Princes Street: Edinburgh |
Maybury Road: Edinburgh |
5.15 |
pm |
32 |
|
3 |
Glasgow |
M8 |
J13 Provan |
J19 Anderston Cross |
4.21 |
pm |
26 |
|
4 |
Manchester |
A5103 |
M60 J5: Northenden |
Mancunian Way |
4.55 |
am |
26 |
|
5 |
Glasgow |
M8 |
J25 Cardonald |
J20 Kingston Bridge |
8.43 |
pm |
24 |
|
6 |
Edinburgh |
A720 |
Edinburgh Services: Musselburgh |
Wester Hailes |
10.27 |
am |
23 |
|
7 |
Manchester |
M60 |
J9 Trafford Park |
J13 Worsley |
4.88 |
pm |
20 |
|
8 |
Manchester |
A580 |
Boothstown: Worsley |
Swinton Park Manchester |
7.21 |
pm |
20 |
|
9 |
Chester |
A51 |
Turning for Great Barrow: Stamford Bridge |
The Bars: Chester City Centre |
4.57 |
pm |
19 |
The amount of time British drivers spent in traffic throughout the year has risen slightly, from 29 hours in 2012 to 30 hours in 2013.
This puts the UK in sixth place in Europe, behind Belgium (first), the Netherlands, Germany, France and Luxembourg respectively.
Drivers in Belgium spent almost twice as long in traffic (58 hours) as British drivers in 2013. The most congested European city is Brussels, where drivers spent 83 hours in traffic last year.
Based on the average hours wasted annually across the countries analysed, Europe’s worst countries for traffic congestion in 2013 were:
|
2013 Rank |
2012 Rank |
Country |
Hours Wasted in Traffic in 2013 |
Hours Wasted in Traffic in 2012 |
Change in Hours Wasted from 2012 to 2013 |
|
1 |
1 |
Belgium |
58 |
58 |
no change |
|
2 |
2 |
Netherlands |
44 |
51 |
-7 |
|
3 |
4 |
Germany |
35 |
36 |
-1 |
|
4 |
3 |
France |
35 |
37 |
-2 |
|
5 |
6 |
Luxembourg |
31 |
28 |
3 |
|
6 |
5 |
United Kingdom |
30 |
29 |
1 |
|
7 |
10 |
Italy |
25 |
22 |
3 |
|
8 |
9 |
Switzerland |
25 |
22 |
3 |
|
9 |
7 |
Austria |
22 |
25 |
-3 |
|
10 |
11 |
Ireland |
20 |
19 |
1 |
|
11 |
8 |
Spain |
17 |
25 |
-8 |
|
12 |
12 |
Hungary |
9 |
15 |
-6 |
|
13 |
13 |
Portugal |
6 |
11 |
-5 |
The traffic situation in mainland Europe in 2013
INRIX analysed data from 13 European countries and the congestion landscape generally aligned closely with each country’s economic outlook.
Those nations struggling with high unemployment and low or negative growth in 2013 typically recorded lower traffic congestion than in 2012.
Spain and Portugal are both examples of this trend: in 2013 Spain’s economy contracted by 1.2% and Portugal experienced record unemployment.
The data shows a marked difference from 2012 where all of the European countries saw decreases in congestion.
In 2013, five nations recorded increases in congestion according to the INRIX Index: the UK, Ireland, Switzerland, Luxembourg and Italy.
The Swiss and British economies both grew by 1.9% in 2013.
Although full-year figures have not been released for Ireland and Luxembourg, estimates show that Ireland is expected to grow by 1.3% and Luxembourg by 1.9% in 2013.
The general trend is that the countries showing increased congestion have a positive economic outlook, while those economies still struggling are experiencing less congested roads.
The INRIX Traffic Scorecard analysed traffic in major metropolitan areas across Europe, providing a comprehensive snapshot into the intractable issues of urban traffic congestion.
In the countries analysed by the report, the top 25 most congested cities in Europe and annual average hours wasted in traffic are:
|
2013 Rank |
2012 Rank |
Metropolitan area |
Hours Wasted in 2013 |
Annual Change in Hours from 2012 |
|
1 |
1 |
Brussels |
83 |
0 |
|
2 |
3 |
London commute zone |
82 |
9 |
|
3 |
2 |
Antwerp |
78 |
1 |
|
4 |
4 |
Rotterdam |
63 |
-8 |
|
5 |
5 |
Stuttgart |
60 |
-5 |
|
6 |
9 |
Cologne |
56 |
-2 |
|
7 |
13 |
Milan |
56 |
5 |
|
8 |
6 |
Paris |
55 |
-8 |
|
9 |
10 |
Ghent |
54 |
1 |
|
10 |
15 |
Karlsruhe |
53 |
5 |
|
11 |
8 |
Amsterdam |
50 |
-9 |
|
12 |
11 |
‘s Gravenhage |
49 |
-3 |
|
13 |
14 |
Dusseldorf |
49 |
-2 |
|
14 |
12 |
Hamburg |
48 |
-3 |
|
15 |
7 |
Utrecht |
48 |
-13 |
|
16 |
19 |
Gr. Manchester |
46 |
1 |
|
17 |
18 |
Munich |
44 |
-0 |
|
18 |
17 |
Lyon |
44 |
-3 |
|
19 |
22 |
Grenoble |
42 |
1 |
|
20 |
20 |
Charleroi |
41 |
-1 |
|
21 |
16 |
Bordeaux |
41 |
-5 |
|
22 |
23 |
Ruhrgebiet |
40 |
0 |
|
23 |
21 |
Toulouse |
39 |
-1 |
|
24 |
24 |
Merseyside |
39 |
2 |
|
25 |
25 |
S. Nottinghamshire |
39 |
3 |


Login to comment
Comments
No comments have been made yet.