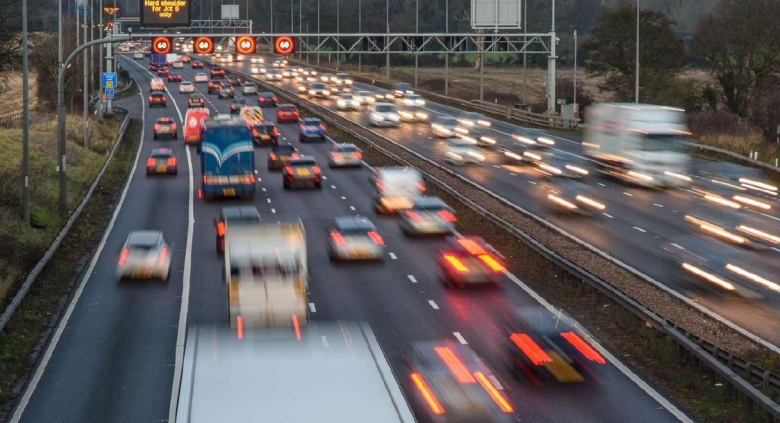
Car trips for both car drivers and passengers increased in 2023, but have not yet returned to pre-pandemic levels, according to the latest National Travel Survey (NTS) results.
In 2023, average trips increased for both car drivers and passengers to 363 trips per person and 185 trips per person respectively.
The NTS is the Department for Transport’s household survey of personal travel by residents of England travelling within Great Britain, from data collected through interviews and a seven-day travel diary.
Driving by car was the most frequent mode to begin a trip, representing 39% of trips.
Females made more car trips than males, however, males made longer car journeys than females.
Outside London, residents in England relied on cars for commuting, with 70% of commuting trips made by car by residents from urban areas outside London, and this increased to 81% by residents in rural areas (excluding London).
Jack Cousens, head of roads policy for The AA, said the findings show that greater use of road transport and particularly cars still signals a return to near-normality after the disruption of Covid and the lockdowns.
He said: “The car is not a luxury but the means for the majority of people to go about their daily lives.
“This they manage despite pump prices at levels way above anything they experienced before the pandemic.
“And that is why an increase to fuel duty in October will not be just ‘painful’ but debilitating for workers and families on lower incomes.”
Walking trips
Average trips made by people living in England overall increased by 6% in 2023 compared to 2022, however, trip rates remain lower than in 2019 (-4%) with 915 trips made on average in 2023.
Trip rates for active transport modes such as walking and cycling have remained similar in 2023 compared to 2022.
Walking trips continued to show an increase of 5% compared to 2019 levels with 263 walking trips per person in 2023, similar to 2022 (267 trips per person).
Where more than one transport mode is used within trips, 60% of these trips began with walking in 2023.
Nearly all walks recorded in the NTS were under 5 miles in 2023 (99.8%). Most trips to and from school for trip length of under 1 mile were made by walking (80% for children aged 5 to 10 and 89% for children aged 11 to 16) in 2023. Average walking distance travelled was the highest on record since 2002 with 225 miles per person. In 2023, females of all ages made more walking trips on average and walked a greater distance than males, with the age group 30 to 39 making the most walking trips with 327 trips per person.
Half of public transport trips use a single mode of transport, the remaining half use more than one transport mode.
Around 27% of multi-modal public transport trips in England involved more than one public transport mode.
Average trips by buses outside London increased by 8% in 2023 compared to 2022 with 25 trips per person.
This may have at least partially been impacted by the national £2 bus fare cap which came into effect on buses outside London from January 2023 under the previous government.
Trip rates on London buses have remained similar in 2023 to 2022 with 14 trips per person.
Trip rates on buses are however still lower than pre-pandemic levels.
The most common trip purpose in 2023 was for shopping with 169 trips per person.
Females aged 40 and over and males aged 60 and over made most of their trips for shopping in 2023. This was followed by commuting with 117 trips per person.
Commuting accounted for the longest distance travelled with 1,055 miles per person.
COVID-19 and travel in 2023
The National Travel Survey has found that, broadly, personal travel increased in 2023 but had not returned to pre-pandemic trends.
There were increases on many public transport modes such as buses outside London, London Underground and surface rail. Active transport modes (walking and cycling) remained fairly stable compared to 2022.
This is consistent with the DfT’s COVID-19 transport use statistics which show that travel by various transport modes, while varying month-to-month, remained below the pre-pandemic reference point. Monthly domestic public transport use has grown during 2023, although it has remained below pre-pandemic levels.
The DfT's latest data follows on from statistics that show London as the third most congested city in Europe.
London drivers lost 99 hours sitting in congestion during 2023, three percent above pre-pandemic delays and two percent more than 2022. The total cost to London was £3.8 billion, averaging £902 per driver.
For the UK as whole, traffic congestion cost the country £7.5 billion - £718 million more than in 2022. The average UK driver lost 61 hours due to traffic congestion last year – a 7% increase on 2022’s 57 hours lost with the capital accounting for approximately 50% of all UK traffic delay.


Login to comment
Comments
No comments have been made yet.