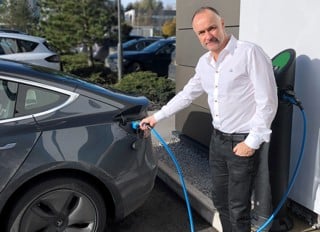
The number of public electric vehicle (EVs) charge points in the UK increased by 26% over the past 12 months, compared to a 186% rise in sales of EVs in 2020.
Analysis of new Government charge point data, published this week, suggests that the rate of growth of the public charging network is not fast enough to meet growing demand for EVs, according to EO Charging (EO).
It reveals that 4,270 public charge-points have been installed in the past 12 months, an increase of just 26%
By comparison, UK sales of electric cars increased from 1.6% of the market in 2019 to 6.6% of the market in 2020, a 186% year-on-year increase in volume.
EO claims that the public charging infrastructure is not being put in place fast enough to cope with this surging demand.
Charlie Jardine, CEO and founder at EO, explained: “While the best scenario for EV drivers is to be able to charge at home or at work, this is not always possible.
“It’s vital that we develop an extensive and reliable public charging network both for private and business road users. Without it, we risk putting people off EVs when the ball is just starting to roll.”
The company says that while the Government data only measures public charge points, its experience suggests there is much greater progress being made in the fleet sector, which accounts for 59% of vehicles on UK roads.
Many companies with large business fleets such as DPD, Amazon and Hermes are already heavily investing in EVs.
Recently released data from the Society of Motor Manufacturers and Traders (SMMT) revealed that electric van sales were up an incredible 64.4 per cent in 2020 compared to 2019.
EO, which is focused on business fleets rather than consumer vehicles, more than tripled its revenues in 2020, fuelled by some major contract wins with companies in the UK and overseas installing charging infrastructure to support their growing EV fleets.
Jardine continued: “We’ve seen a surge in demand in recent months from businesses who are acting on the Government’s commitment to electric vehicles and growing sentiment from their customers, and are suddenly accelerating their plans to switch to electric.
“Large fleet owners are leading the way in installing EV infrastructure but while they are putting in place their own charge points at depots and employees’ homes, we still need a reliable public charging network – for both private users and business users.
“Company fleets across the UK will need on the go charging for vehicles travelling up and down the country so the acceleration of the growth of the public network is vital.”
Analysis of the Government data reveals significant disparities between the rate at which public charging infrastructure is being installed in different counties, and indeed by different local authorities.
Wales has shown the biggest percentage increase in chargers in the past 12 months (41.3%), followed by the West Midlands (36.4%) and Yorkshire & the Humber (36.3%).
At the other end of the scale Northern Ireland has just added 25 public charge-points over the past year, an 8.5% increase.
Fleet News reported last year how the boss of Britain’s largest vehicle leasing company, Lex Autolease, labelled the country’s EV charging infrastructure “not fit-for-purpose”.
Richard Jones, managing director of Lex Autolease and Black Horse, said parts of the country are poorly served, limiting the wider adoption of EVs.
The Government, however, has announced a further £20 million in funding to boost the number of on-street electric vehicle (EV) charge points.
Transport secretary Grant Shapps has told councils that the On-Street Residential Chargepoint Scheme (ORCS) will continue into 2021/22.
The scheme helps councils install charge points for residents without off-street parking to charge their vehicle.
Increase in public electric vehicle charging devices in the past 12 months
|
Region |
January 2021 |
January 2020 |
Increase in past 12 months |
Percentage increase in past 12 months |
|
Wales |
804 |
569 |
235 |
41.3% |
|
West Midlands |
1,215 |
891 |
324 |
36.4% |
|
Yorkshire & The Humber |
1,056 |
775 |
281 |
36.3% |
|
South East |
2,869 |
2,143 |
726 |
33.9% |
|
East of England |
1,289 |
963 |
326 |
33.9% |
|
London |
6,155 |
4,773 |
1,382 |
29.0% |
|
East Midlands |
1,090 |
862 |
228 |
26.5% |
|
South West |
1,555 |
1,281 |
274 |
21.4% |
|
Scotland |
2,192 |
1,922 |
270 |
14.0% |
|
North West |
1,410 |
1,279 |
131 |
10.2% |
|
North East |
820 |
752 |
68 |
9.0% |
|
Northern Ireland |
320 |
295 |
25 |
8.5% |
|
UK |
20,775 |
16,505 |
4,270 |
25.9% |


Login to comment
Comments
No comments have been made yet.