The rate of charge point installation on the public network reached record levels in 2024, according to new analysis from Zapmap.
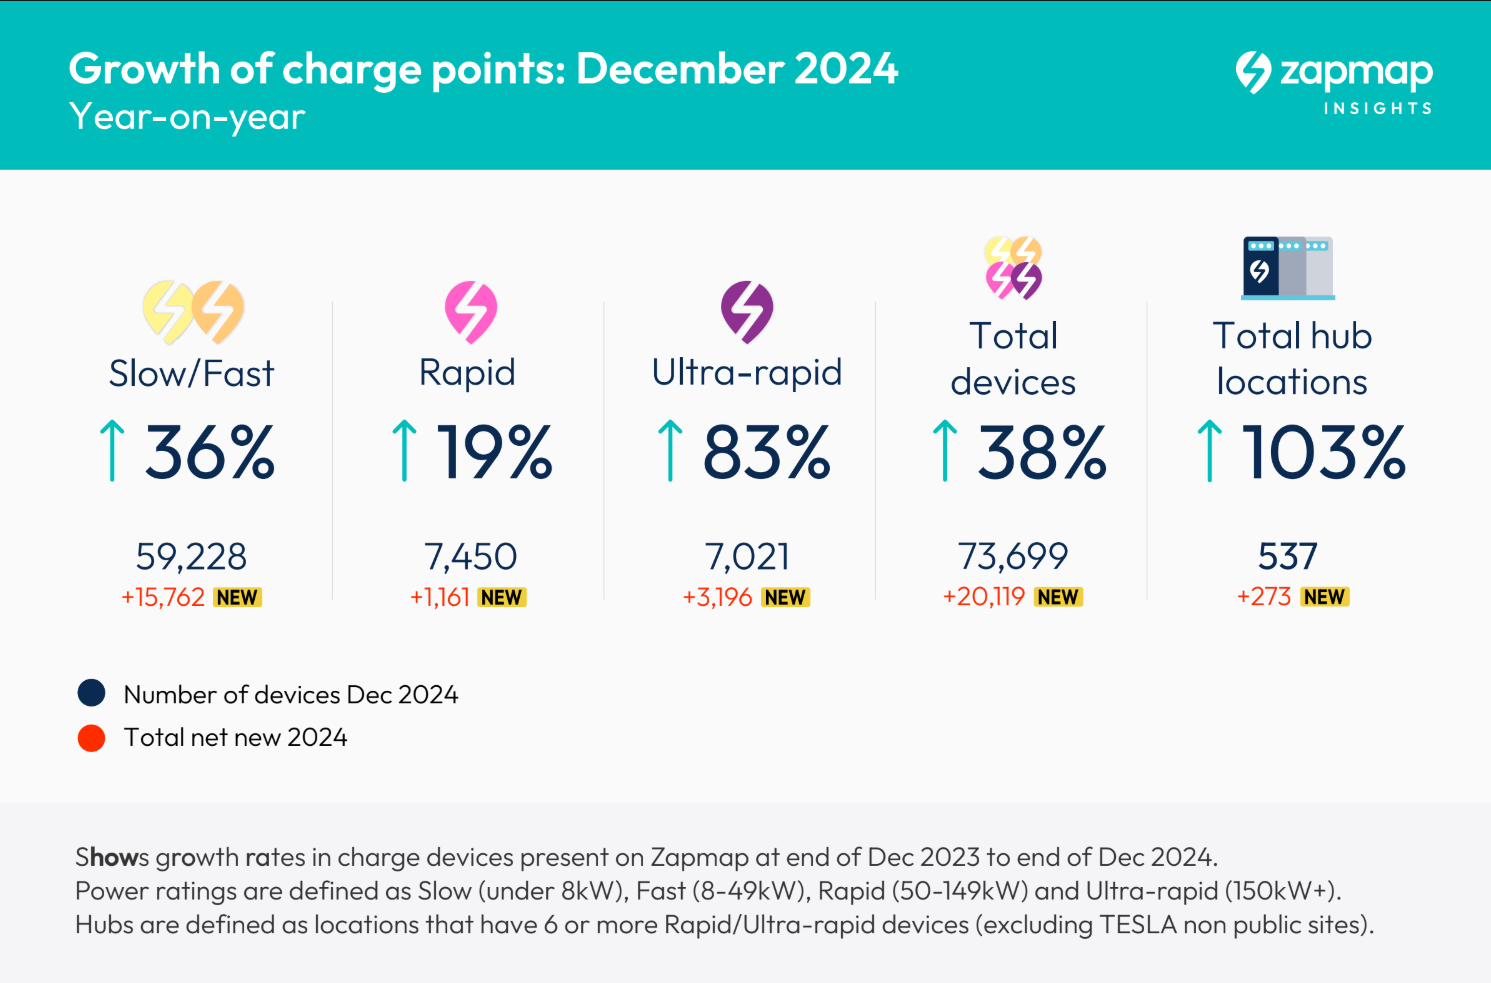
More than 20,000 new charge points were installed in the year, bringing the total number across the country to 73,699 – a year-on-year increase of 38%.
The rate of installation of charge points has also grown from an average of 1,400 per month to 1,650 per month.
Charge point growth was particularly strong in the ultra-rapid segment (150kW+), which saw an increase of 84% in installations since the end of 2023.
There are more than 7,000 150kW+ chargers, with a total of more than 14,000 over 50kW now available, while the number of hubs (six or more 50kW chargers) rose from 264 at the end of 2023 to 537 at the end of 2024.
Destination chargers, which enable EV drivers to charge while they stop, rather than stopping to charge, also continue to grow in number.
There are 12,000 additional chargers now available at destinations such as restaurants, hotels, retail car parks and leisure areas across the UK.
While the provision of on-street chargers supporting those EV drivers without off-street parking has grown, 72% of these chargers are concentrated in Greater London.
Many other areas such as Coventry and Liverpool also have good local availability, but overall provision at a local level is still variable.
With the Local Electric Vehicle Infrastructure (LEVI) Government funded projects starting to come to fruition, according to Zapmap, there should be a more equitable distribution of on-street charging provision towards the end of 2025.
Zapmap’s statistics also show significant progress in the distribution of en-route chargers outside London.
This year, nine out of 12 geographical areas of the UK now have over 1,000 50kW-plus chargers.
Wales and the North West continue to be less well covered, although they have made good progress over the course of 2024, while the pace of installations in Northern Ireland continues to lag.
Melanie Shufflebotham, co-founder and chief operating officer at Zapmap, said: “Last year was another record year for charging infrastructure growth with en-route charging points in particular being installed ahead of the growth in electric vehicle sales.
“As we move into 2025, we can expect to see the benefits of the PCPR consumer regulations coming into effect combined with the impact of LEVI funded projects reaching local authorities and bringing more equitable access to charging devices.
“Confirmation on a strong and clear ZEV mandate, following the Government’s recently communicated consultation, will also help to bring certainty and confidence to both infrastructure providers and UK drivers that the transition is happening now.”

RAC senior policy officer Rod Dennis welcomed the improving availability of EV charge points. However, he said: “It’s also important that their affordability is addressed, especially for anyone without a driveway who can’t charge cheaply at home.
“There is still a huge gulf in prices between public and home chargers, partly due to the higher rate of VAT at public charge points compared to the 5% domestic rate.
“Charge point installations and cheaper public charging costs are two sides of the same coin when it comes to ramping up private EV demand.”
Monthly total number of charge points available in the UK up to January 1, 2025
| Year | Month | Total charging devices | 50kW or above devices | Rapid charging or above devices under former definition | Total charging devices percentage difference year on year | 50kW or above devices percentage difference year on year | Rapid charging or above devices under former definition percentage difference year on year |
|---|---|---|---|---|---|---|---|
| 2021 | December | 27,614 | 0 | 5,088 | 0 | 0 | 0 |
| 2022 | January | 28,375 | 0 | 5,156 | 0 | 0 | 0 |
| 2022 | February | 28,979 | 0 | 5,279 | 0 | 0 | 0 |
| 2022 | March | 29,583 | 0 | 5,418 | 0 | 0 | 0 |
| 2022 | April | 30,290 | 0 | 5,494 | 0 | 0 | 0 |
| 2022 | May | 31,358 | 0 | 5,741 | 0 | 0 | 0 |
| 2022 | June | 31,855 | 0 | 5,846 | 0 | 0 | 0 |
| 2022 | July | 32,011 | 0 | 5,974 | 0 | 0 | 0 |
| 2022 | August | 32,929 | 0 | 6,112 | 0 | 0 | 0 |
| 2022 | September | 33,693 | 0 | 6,208 | 0 | 0 | 0 |
| 2022 | October | 34,637 | 0 | 6,395 | 0 | 0 | 0 |
| 2022 | November | 35,352 | 0 | 6,465 | 0 | 0 | 0 |
| 2022 | December | 36,416 | 0 | 6,663 | 32% | 0 | 31% |
| 2023 | January | 37,055 | 0 | 6,887 | 31% | 0 | 34% |
| 2023 | February | 37,625 | 0 | 7,554 | 30% | 0 | 43% |
| 2023 | March | 38,737 | 0 | 7,400 | 31% | 0 | 37% |
| 2023 | April | 40,150 | 0 | 7,647 | 33% | 0 | 39% |
| 2023 | May | 42,259 | 0 | 7,840 | 35% | 0 | 37% |
| 2023 | June | 43,252 | 0 | 8,277 | 36% | 0 | 42% |
| 2023 | July | 44,020 | 0 | 8,461 | 38% | 0 | 42% |
| 2023 | August | 45,522 | 0 | 8,690 | 38% | 0 | 42% |
| 2023 | September | 48,187 | 0 | 8,912 | 43% | 0 | 44% |
| 2023 | October | 49,220 | 8,908 | 9,112 | 42% | 0 | 42% |
| 2023 | November | 0 | 0 | 0 | 0 | 0 | 0 |
| 2023 | December | 52,602 | 9,615 | 9,934 | 44% | 0 | 49% |
| 2024 | January | 53,677 | 10,118 | 10,491 | 45% | 0 | 52% |
| 2024 | February | 55,060 | 10,504 | 0 | 46% | 0 | 0 |
| 2024 | March | 56,983 | 10,921 | 0 | 47% | 0 | 0 |
| 2024 | April | 59,670 | 11,590 | 0 | 49% | 0 | 0 |
| 2024 | May | 61,056 | 11,882 | 0 | 44% | 0 | 0 |
| 2024 | June | 62,418 | 12,209 | 0 | 44% | 0 | 0 |
| 2024 | July | 64,632 | 12,474 | 0 | 47% | 0 | 0 |
| 2024 | August | 66,688 | 13,155 | 0 | 46% | 0 | 0 |
| 2024 | September | 67,980 | 13,422 | 0 | 41% | 0 | 0 |
| 2024 | October | 70,042 | 13,683 | 0 | 42% | 54% | 0 |
| 2024 | November | 71,016 | 13,800 | 0 | 0 | 0 | 0 |
| 2024 | December | 72,271 | 14,075 | 0 | 37% | 46% | 0 |
| 2025 | January | 73,334 | 14,448 | 0 | 37% | 43% | 0 |
| Note number | Note text |
|---|---|
| 1 | Reported as operational at midnight, 1 January 2025. |
| 2 | 'Total devices' represent publicly available charging devices at all speeds. A device can have a number of connectors of various speeds. |
| 3 | Zapmap had an issue with their data collection whereby it incorrectly categorising 22kW fast chargers as 43kW rapid chargers for some devices in the February 2023 data. This was rectified in March 2023. |
| 4 | From October 2023 onwards, the speed category 'rapid charging or above devices' has been replaced. It now represents devices whose fastest connector is rated at 50kW or above. The category is currently labelled '50kW or above devices'. There is no reliable historical data available for this new category. |
| 5 | Under the former definition (before October 2023), 'rapid charging or above devices' were those whose fastest connector is rated at 25kW or above. |
| 6 | Data for November 2023 presented a wider than expected divergence in figures between DfT and Zapmap's estimate, which can be traced to an individual data feed. As part of assuring quality of DfT's Official Statistics products it paused the release of this data while investigating this. |
| 7 | In February 2024, DfT stopped reporting on the number of rapid charging or above devices (former definition). |
| 8 | From September 2024, a new data structure was used for data supplied by contractors to the Department for Transport. This led to a minor error in analysis, which caused a slight undercount (15 devices, 0.1%) to the statistics on devices rated 50kW or above. This was corrected and the statistics affected were revised in the October 2024 release. |
| 9 | A small proportion of charging devices (less than 0.2% of the total) were manually removed from the figures in November 2024's release due to a data quality issue identified in one chargepoint operator's data feed to Zapmap. |
| 10 | In October, there was a problem with the data feed for one particular chargepoint operator. This has been corrected in the December publication. DfT's count of charging devices was affected in two ways. Firstly there was an erroneous inclusion of charging devices for fleet vehicles. This was corrected manually in the November statistic. Secondly, the operator changed its method for calculating the number of charging devices. Together these have affected the total count of UK charging devices by under 0.4%. |


Login to comment
Comments
No comments have been made yet.