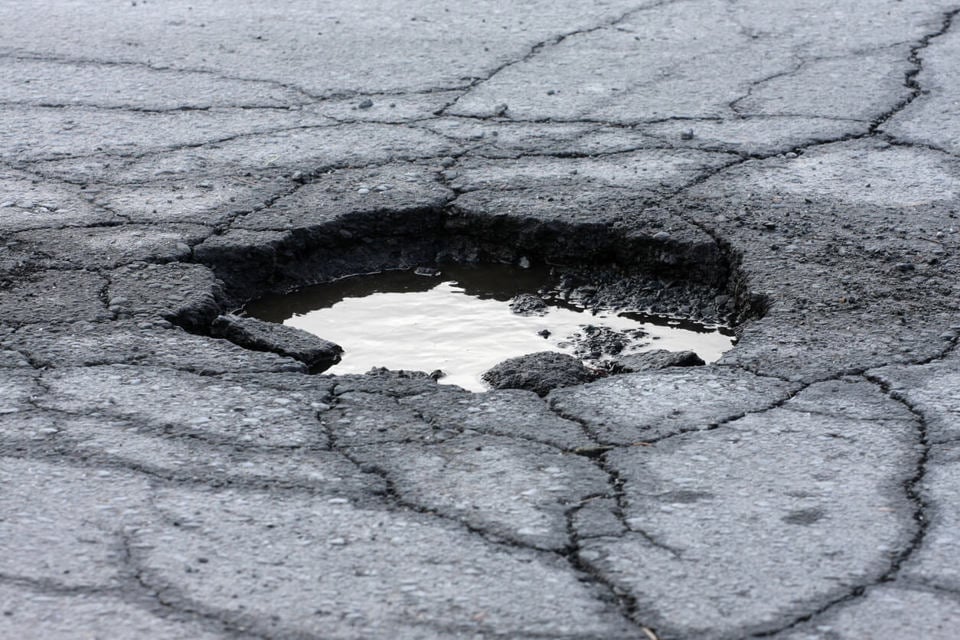
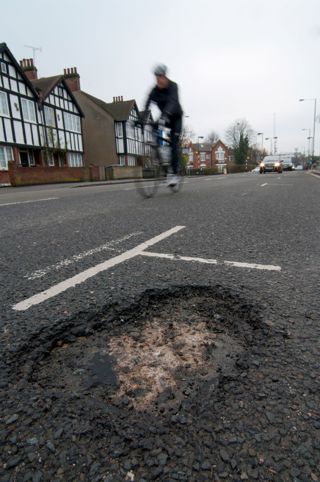
Councils and road authorities in England, Scotland and Wales have paid out almost £13 million for vehicle damage caused by potholes between January 2018 and October 2021, new research suggests.
Motorists across England, Scotland and Wales submitted more than 145,000 compensation claims to councils, with 37,366 motorists receiving compensation, on average, of £347 – a success rate of 25%.
The cost of filling a pothole has previously been estimated to cost £47.
National Highways (formerly Highways England), in charge of England’s trunk roads, was the highest paying authority, stumping up just over £865,000 in compensation.
The research, from What Car?, comes after The Asphalt Industry Alliance published its latest ALARM report, with local authorities in England and Wales facing a nine-year backlog of road repairs estimated to cost more than £12 billion.
Five county and city councils were found to have paid more than half a million in compensation between 2018 and October 2021, including Lincolnshire County Council, Surrey County Council, Lancashire County Council, Staffordshire County Council, and Stoke-on-Trent City Council.
Lincolnshire County Council received the highest number of damage claims across the four years, with 8,810 claims, of which 4,313 were successful, costing the local authority more than £760,000 – £177 per claim.
Wiltshire Council was found to have the highest share of compensation claims paid, with 86% of the 1,594 claims paid, totalling £302,000 over the four-year period.
Slough Borough Council and Stoke-on-Trent City Councils were the second and third highest, paying out 65% and 62% of all claims, respectively.
In total, 11 councils across Britain paid more than half of all claims.
Not all local authorities answered the Freedom of Information request; 344 responded while 161 said they were unable to provide figures as road compensation often fell under the remit of county and city councils, rather than borough or district councils.
Meanwhile, a survey of motorists it conducted found almost one in four 24% motorists had damaged their vehicle in the past 18 months from hitting a pothole.
Two-thirds of respondents were aware they could claim for the damage caused from their local roads authority, though only one in 10 had ever done so.
Top 20 councils and road authorities per pothole compensation
| Position | Council or Road Authority | Total Claims | Claims successful | Share of claims paid out |
Total Payout (£) |
| 1 | Highways England | 4,781 | 2,707 | 56.62% | 865,254.75 |
| 2 | Lincolnshire County Council | 8,810 | 4,313 | 48.96% | 764,588.00 |
| 3 | Surrey County Council | 6,380 | 893 | 14.00% | 608,284.00 |
| 4 | Lancashire County Council | 4,016 | 1,903 | 47.39% | 520,745.26 |
| 5 | Staffordshire County Council | 5,659 | 1,502 | 26.54% | 517,367.00 |
| 6 | Stoke-on-Trent City Council | 1,430 | 892 | 62.38% | 507,055.78 |
| 7 | Oxfordshire County Council | 3,578 | 1,512 | 41.11% | 378,770.00 |
| 8 | Cambridgeshire County Council | 2,666 | 942 | 35.33% | 354,931.56 |
| 9 | Rotherham Metropolitan Borough Council | 804 | 75 | 9.33% | 350,500.00 |
| 10 | Dumfries and Galloway Council | 1,568 | 585 | 37.31% | 324,111.39 |
| 11 | Wiltshire Council | 1,594 | 1,381 | 86.64% | 302,911.10 |
| 12 | Shropshire Council | 2,412 | 811 | 33.62% | 282,454.13 |
| 13 | Dudley Metropolitan Borough | 463 | 238 | 51.40% | 262,862.49 |
| 14 | West Northamptonshire Council* | 2,995 | 770 | 25.71% | 234,961.87 |
| 15 | Derbyshire County Council | 2,099 | 772 | 36.78% | 222,264.60 |
| 16 | Hampshire County Council | 6,046 | 732 | 12.11% | 219,284.22 |
| 17 | Northumberland County Council | 1,409 | 663 | 47.05% | 196,450.00 |
| 18 | Warwickshire County Council | 1.153 | 515 | 44.67% | 189,853.00 |
| 19 | Flintshire County Council | 600 | 248 | 41.33% | 177,205.00 |
| 20 | Devon County Council | 2,734 | 720 | 26.34% | 170,069.00 |
*As of the April 1, 2021, South Northamptonshire Council, Northamptonshire County Council, Northampton Borough Council and Daventry District Council ceased to exist and formed the new West Northamptonshire Unitary Council. The data provided prior to the April 1, 2021, relates to those claims submitted to Northamptonshire County Council and covers the County as a whole. The data provided since April 1, 2021, relates to the West Northamptonshire area of the County only.


Login to comment
Comments
No comments have been made yet.