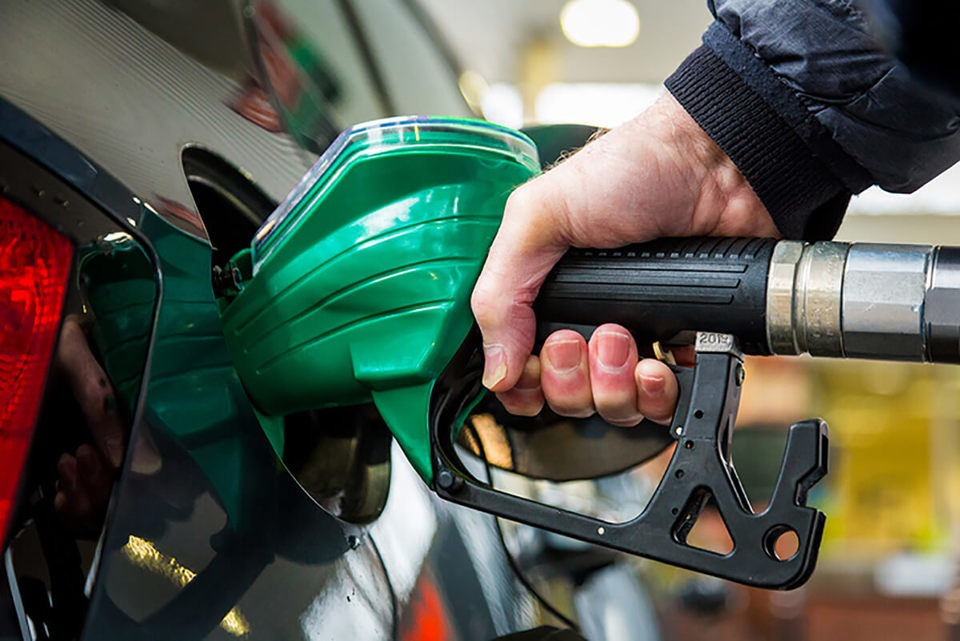
The Chancellor is expected to maintain the freeze in fuel duty for another year as drivers suffered their biggest monthly fuel price rises in five months.
The average price of petrol rose by 4p per litre (ppl) in February, while diesel increased by almost 5ppl, data from RAC Fuel Watch shows.
Unleaded went from 140.75p at the start of the month to 144.76p by the close, adding more than £2 to the price of a full tank (£77.41 to £79.62).
Diesel rose from 148.53p to 153.22p (4.7p) increasing the cost of filling up an average 55-litre family car by £2.60 to £84.27.
The price hikes, says the RAC, have been driven by the price of oil breaking through the $80 a barrel mark on February 8 and staying there for the rest of the month.
This, combined with the pound only being worth $1.26 meant retailers had to pay more for fuel on the wholesale market as – similar to oil – fuel is traded in dollars.
RAC Fuel Watch data also shows that drivers in Northern Ireland are still getting a far better deal at the pumps, with unleaded being sold 5.6p cheaper and diesel 4.6p cheaper (139.19p for petrol and 148.62p for diesel).
With the Chancellor, Jeremy Hunt, due to deliver the Budget tomorrow (Wednesday, March 6), fuel duty is expected to be frozen again, costing the Treasury £5 billion.
The Times reports Hunt will extend the 5p cut in fuel duty, which is due to expire next month (April) and was first introduced by Rishi Sunak when Chancellor in 2022, for another year.
RAC analysis of prices from the Government’s voluntary open data scheme on February 29 shows petrol is just under 2p (1.8p) cheaper when bought at one of the country’s big four supermarkets (143p v 144.76p) and diesel is only a penny cheaper (152.1p v 153.22p).
|
29/02/2024 |
Average |
Min |
Max |
Difference |
|
Asda |
143.6p |
136.7p |
154.9p |
18.2p |
|
Morrisons |
143.5p |
140.7p |
153.9p |
13.2p |
|
Sainsbury's |
142.6p |
137.9p |
147.9p |
10.0p |
|
Tesco |
142.1p |
136.9p |
143.9p |
7.0p |
|
Whole UK |
143.0p |
136.7p |
154.9p |
18.2p |
It also highlights that there is an 18p-per-litre difference between the supermarket forecourts selling the lowest and highest priced unleaded, both of which are Asda sites.
The lowest price was 136.7p at its sites in Middleton, Leeds, and Ballyclare, north of Belfast in Northern Ireland, and the most expensive was 163.9p at Parkgate Road in Chester.
For diesel, the gap between the cheapest and most expensive supermarket forecourts is greater at 21p. Tesco offered drivers the lowest priced at 142.9p at Banbridge in Northern Ireland and Asda had the dearest at 163.9p, again at Parkgate Road in Chester.
|
29/02/2024 |
Average |
Min |
Max |
Difference |
|
Asda |
152.9p |
145.7p |
163.9p |
18.2p |
|
Morrisons |
152.6p |
149.4p |
160.9p |
11.5p |
|
Sainsbury's |
151.6p |
145.9p |
158.9p |
13.0p |
|
Tesco |
151.1p |
142.9p |
153.9p |
11.0p |
|
Whole UK |
152.1p |
142.9p |
163.9p |
21.0p |
RAC fuel spokesman Simon Williams said: “Our data shows that in February, drivers endured the highest monthly average fuel price increases since September 2023. What’s more diesel’s 4.7p rise was the 14th largest since the year 2000 and the 4p that went on to petrol was the 17th biggest increase since the start of the century.
“What’s especially galling is the continuing difference in price between Northern Ireland and the rest of the UK. On average fuel is 5p cheaper there, with big retailers appearing happy to operate on thinner margins per litre.”
Regional pump prices
|
Unleaded |
01/02/2024 |
29/02/2024 |
Change |
End of month variance to UK average |
|
UK average |
140.75 |
144.76 |
4.01 |
|
|
East |
141.61 |
145.48 |
3.87 |
0.7 |
|
East Midlands |
141.15 |
145.19 |
4.04 |
0.4 |
|
London |
142.69 |
145.86 |
3.17 |
1.1 |
|
North East |
139.81 |
143.79 |
3.98 |
-1.0 |
|
North West |
140.22 |
144.64 |
4.42 |
-0.1 |
|
Northern Ireland |
136.06 |
139.19 |
3.13 |
-5.6 |
|
Scotland |
140.22 |
144.56 |
4.34 |
-0.2 |
|
South East |
141.90 |
145.62 |
3.72 |
0.9 |
|
South West |
140.89 |
144.58 |
3.69 |
-0.2 |
|
Wales |
139.66 |
143.85 |
4.19 |
-0.9 |
|
West Midlands |
140.63 |
144.92 |
4.29 |
0.2 |
|
Yorkshire and the Humber |
139.78 |
144.21 |
4.43 |
-0.5 |
|
Diesel |
01/02/2024 |
29/02/2024 |
Change |
End of month variance to UK average |
|
UK average |
148.53 |
153.22 |
4.69 |
|
|
East |
148.84 |
153.70 |
4.86 |
0.5 |
|
East Midlands |
148.67 |
153.45 |
4.78 |
0.2 |
|
London |
150.28 |
154.13 |
3.85 |
0.9 |
|
North East |
147.76 |
152.54 |
4.78 |
-0.7 |
|
North West |
147.89 |
152.91 |
5.02 |
-0.3 |
|
Northern Ireland |
145.05 |
148.62 |
3.57 |
-4.6 |
|
Scotland |
149.14 |
153.71 |
4.57 |
0.5 |
|
South East |
149.78 |
154.39 |
4.61 |
1.2 |
|
South West |
148.60 |
153.40 |
4.80 |
0.2 |
|
Wales |
147.87 |
152.96 |
5.09 |
-0.3 |
|
West Midlands |
148.38 |
153.33 |
4.95 |
0.1 |
|
Yorkshire and the Humber |
148.25 |
153.02 |
4.77 |
-0.2 |


Login to comment
Comments
No comments have been made yet.