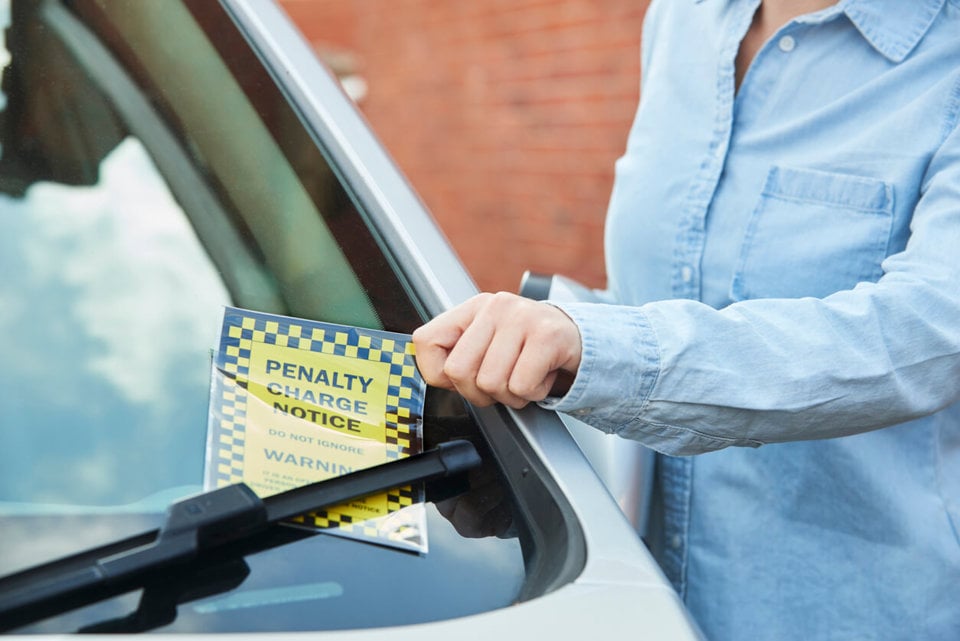
Private parking penalties incurred by company car and van drivers cost £2.21 million in the first half of the year, according to new figures from Lex Autolease.
The data reveals that the proportion of company car and van drivers fined for parking on private land increased by 16% in the first half of the year.
The research was compiled from the firm’s fleet of 378,000 leased company vehicles operating across the UK, which has grown by 14.5% in the period June 2016 to June 2017.
The findings also revealed the proportion of drivers penalised for motoring offences increased by 9% between January and June compared with the first half of 2016. And the bill for businesses reached £5.67m, with the average cost per driver up 13% year-on-year.
Guy Mason, operations director at Lex Autolease, said: “It’s clear from the findings that businesses will be feeling the effects of the fines and penalties that drivers are increasingly racking up.
“While there are issues with poor signage in some private car parks, businesses would benefit significantly from a greater focus on driver awareness and education to change behaviour. Putting in place mandatory training schemes for employees may also help.”
The proportion of drivers fined for offences, such as breaking the speed limit or driving while on a mobile phone was up 2% year-on-year in the first six months of 2017.
In total, company drivers committed 102,397 offences between January and June, compared with 81,994 recorded in H1 2016.
The figures for the growth in number and value of offences have been adjusted in line with the 14.5% growth in the Lex Autolease’s fleet.
|
Fine type |
H1 2016 incidents |
H1 2017 incidents |
% increase in value |
% increase in average cost per driver |
|||
|
|
Value |
Average cost per driver |
Value |
Average cost per driver |
2016-2017 |
2016-2017 |
|
|
Speeding * |
£0 |
N/A |
£0 |
N/A |
N N/A |
N/A |
|
|
Parking (Council |
£651,600.00 |
£1.97 |
£776,520 |
£2.05 |
19.17 |
4.06 |
|
|
Parking (Private) |
£1,657,980.00 |
£5.02 |
£2,209,680 |
£5.85 |
33.28 |
16.53 |
|
|
Bus lane |
£726,700.00 |
£2.20 |
£844,155 |
£2.23 |
16.16 |
1.36 |
|
|
Other motoring offences** |
£1,343,651.11 |
£4.07 |
£1,836,469.80 |
£4.86 |
36.68 |
19.41 |
|
|
Total number of offences / fines incurred |
£4,379,931.11 |
£13.27 |
£5,666,824.80 |
£14.99 |
29.38 |
12.96 |
|
|
Fine type |
H1 2016 incidents |
H1 2017 incidents |
% increase in volume |
% increase of fleet proportion |
||
|
|
Volume |
Proportion of fleet (%) |
Volume |
Proportion of fleet (%) |
2016-2017 |
2016-2017 |
|
Speeding * |
22,852 |
6.92 |
26,698 |
7.06 |
16.83 |
2.02 |
|
Parking (Council |
10,860 |
3.29 |
12,942 |
3.42 |
19.17 |
3.95 |
|
Parking (Private) |
27,633 |
8.37 |
36,828 |
9.74 |
33.27 |
16.37 |
|
Bus lane |
11,180 |
3.39 |
12,987 |
3.44 |
16.16 |
1.47 |
|
Other motoring offences** |
9,469 |
2.87 |
12,942 |
3.42 |
36.67 |
19.16 |
|
Total number of offences / fines incurred |
81,994 |
24.85 |
102,397 |
27.09 |
24.88 |
9.01 |
* Includes all endorsable offences such as dangerous driving, driving whilst on a mobile phone, etc.
** Includes all non-endorsable “traffic” offences such as driving in a box junction or stopping on a red route.


Patriot - 22/08/2017 21:55
Fleet managers need to be aware they cannot disclose the name of the driver without permission. The BVRLA’s standard terms and conditions stipulate that the customer is responsible for all road traffic and parking offences and charges. Customers incurring charges or offences would be in breach of the rental or lease agreement and as such the BVRLA member would be able to release the customer’s details to ‘any relevant organisation’. Note that your customer may not be necessarily the driver of the vehicle. It is therefore necessary to ensure that the driver has also given their consent, under a signed data protection clause, for their details to be passed to third parties, including private parking operators. This can either be your own clause or one their employer, as your consumer, has asked them to sign. Fleet managers ignore these guidelines at their peril.