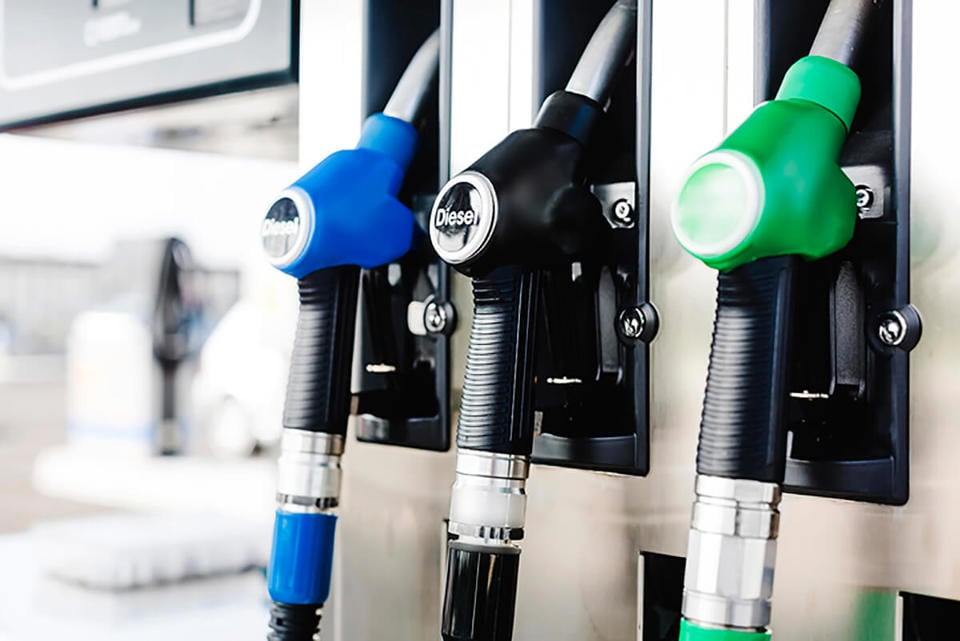
Pump prices have gone up for eight of the past 12 months making both diesel and petrol 13p per litre (ppl) more expensive than this time last year, new RAC Fuel Watch data reveals.
Petrol increased by 1.65p to 130.59ppl and diesel by 1.32p to 132.19ppl in the month. A year ago, however, petrol was 117.51ppl and diesel was 118.37ppl.
The combination of a weaker pound and an oil price of more than $70 a barrel has sent prices shooting up.
The average price of petrol in the UK is now at its highest since the end of July 2014 just before the price of a barrel of oil began to freefall and diesel is at its most expensive since the beginning of October the same year.
However, back then oil was $106 a barrel and the pound was worth $1.70. Now, in stark contrast, oil finished August at $77.54 while sterling was only worth $1.29, which means both petrol and diesel are far more expensive for retailers to buy on the wholesale market. So despite the lower oil price, the substantially weakened pound has caused fuel prices to reach their highest levels for the last four years.
There have also been no significant reductions in the average cost of supermarket fuel since June 24, meaning by the end of August prices had crept up by 3.38p for petrol (123.77p to 127.15p) and by 3.12p for diesel (127.23p to 130.35p).
The cost of filling a 55-litre family car with unleaded is £71.82 – an increase of 91p on July and £7.32 dearer than a year ago. For diesel, the equivalent cost is £73.29 for a tank today – 73p more than last month and £8.19 more expensive than at the end of August 2017.
RAC fuel spokesperson Simon Williams said: “With many factors at play on the global oil market the price of a barrel could easily break through the $80 mark and stay there.
“If this were to happen it would be dire news for drivers and we could even see pump prices heading towards the record highs of April 2012 when petrol hit an average of 142p a litre and diesel 148p.”
Pricing – what has happened to UK pump prices since September 2017
|
|
Petrol prices through month |
Diesel prices through month |
|
August |
▲ Up |
▲ Up |
|
July |
▲ Up |
▲ Up |
|
June |
▼ Down |
▼ Down |
|
May |
▲ Up |
▲ Up |
|
April |
▲ Up |
▲ Up |
|
March |
▬ Unchanged |
▬ Unchanged |
|
February |
▼ Down |
▼ Down |
|
January |
▲ Up |
▲ Up |
|
December |
▲ Up |
▲ Up |
|
November |
▲ Up |
▲ Up |
|
October |
▼ Down |
▲ Up |
|
September |
▲ Up |
▲ Up |
Regional fuel price variation
Regional average unleaded pump prices
The North East and Scotland suffered the largest rise in the price of unleaded in August at 1.81p a litre. Northern Ireland once again had the cheapest petrol at the start and end of the month, closing August at 129.38p but the East Midlands had the smallest a 1.45p a litre. In the South East unleaded was the most expensive across the UK at 131.46p.
|
Unleaded |
01/08/2018 |
30/08/2018 |
Change |
|
North East |
128.01 |
129.82 |
1.81 |
|
Scotland |
128.68 |
130.49 |
1.81 |
|
North West |
128.40 |
130.18 |
1.78 |
|
South East |
129.69 |
131.46 |
1.77 |
|
Wales |
128.67 |
130.37 |
1.70 |
|
Yorkshire And The Humber |
128.32 |
130.00 |
1.68 |
|
London |
129.52 |
131.18 |
1.66 |
|
West Midlands |
128.44 |
130.09 |
1.65 |
|
South West |
129.27 |
130.88 |
1.61 |
|
East |
129.38 |
130.93 |
1.55 |
|
Northern Ireland |
127.93 |
129.38 |
1.45 |
|
East Midlands |
128.90 |
130.26 |
1.36 |
Regional average diesel pump prices
Diesel went up the most in the North West and North East, increasing by around 1.48p a litre. Northern Ireland experienced the lowest increase at 99p as well having the cheapest diesel at 131.77p a litre. Unsurprisingly, the South East also had the dearest diesel in the land at 134.03p.
|
Diesel |
01/08/2018 |
30/08/2018 |
Change |
|
North West |
131.75 |
133.23 |
1.48 |
|
North East |
131.15 |
132.62 |
1.47 |
|
South East |
132.64 |
134.03 |
1.39 |
|
Wales |
131.72 |
133.09 |
1.37 |
|
Scotland |
132.10 |
133.46 |
1.36 |
|
London |
132.39 |
133.70 |
1.31 |
|
West Midlands |
131.34 |
132.63 |
1.29 |
|
Yorkshire And The Humber |
131.12 |
132.41 |
1.29 |
|
East |
132.56 |
133.84 |
1.28 |
|
East Midlands |
131.86 |
133.12 |
1.26 |
|
South West |
132.15 |
133.41 |
1.26 |
|
Northern Ireland |
130.78 |
131.77 |
0.99 |


Login to comment
Comments
No comments have been made yet.