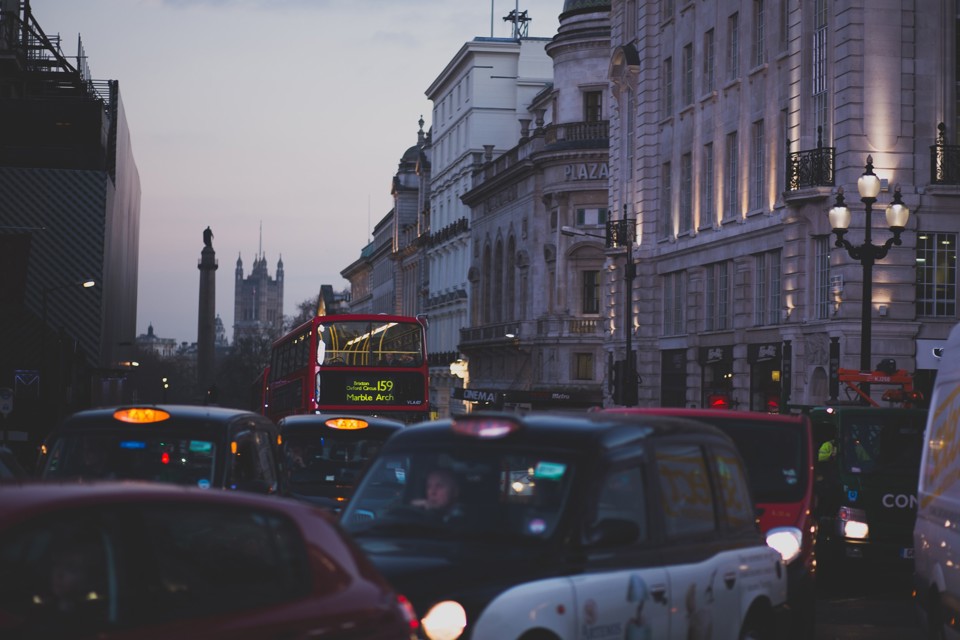
London, with 227 hours lost due to congestion, and Birmingham at 134 hours, have been ranked as the worst cities in the UK for time lost due to congestion by Inrix.
Publishing its annual Global Traffic Scorecard, Inrix has identified and ranked congestion and mobility trends in more than 200 cities across 38 countries.
In the UK, the 2018 Traffic Scorecard analysed congestion and the severity of it in the top 20 urban areas. Drivers in the UK lost an average of 178 hours a year due to congestion, costing drivers £7.9 billion in 2018, an average of £1,317 per driver.
London drivers lost up to £1,680 per year due to congestion, followed by Edinburgh (£1,219), Manchester (£1,157) and Leicester (£1,145). Liverpool had the lowest cost of congestion among the UK cities studied at £878 per driver.
“Congestion costs Brits billions of pounds each year. Unaddressed, it will continue to have serious consequences for national and local economies, businesses and citizens in the years to come,” said Trevor Reed, transportation analyst at INRIX.
“In order to avoid traffic congestion becoming a further drain on our economy, it is increasingly obvious that authorities need to adapt. With the help of new and innovative intelligent transportation solutions, we can begin to tackle the mobility issues we face today.”
At the global level, Moscow topped the list of the world’s most gridlocked cities (210 hours lost due to congestion) when weighting for population, followed by Istanbul, Bogota, Mexico City and São Paulo.
The dominance of Latin American cities should not be a surprise due to their rapid urbanisation, high levels of informal settlements, unforgiving topographies and financial volatility. London was the only UK city in the Top 10 most congested cited in the world.
Glynn Barton, director of network management at Transport for London (TfL), said: “We are taking bold action to reduce congestion and improve London’s poor air quality. This includes removing the Congestion Charge exemption for private hire vehicles and reducing the time taken to clear up unplanned incidents, ensuring that roadworks by utilities companies and others are better coordinated. We are also working with the freight industry to encourage more efficient deliveries across the capital.”
“To directly tackle poor air quality, we are ensuring that buses, taxis and private hire vehicles are as green as possible, alongside the introduction of the Ultra-Low Emission Zone this April.
“In delivering the Mayor’s ambitious plans for 80% of all journeys to be made by public transport, walking or cycling by 2041, our plans will further help tackle congestion across London.”
INRIX analysed 500 Terabytes of data from 300 million different sources covering more than five million miles of road.
The data used in the 2018 Global Scorecard is the congested or uncongested status of every segment of road for every minute of the day, as used by millions of drivers around the world that rely on INRIX-based traffic services.
Caroline Pidgeo, chair of the London Assembly Transport Committee, said: “The revelation that London is the sixth most gridlocked city in the world, behind Moscow, Istanbul, Bogota and Mexico City, will come as no surprise to most road users.
“This is a shockingly expensive fact and hugely damaging to our global reputation. Getting millions of Londoners to and from work every day is a massive challenge – but we really have to try harder for the sake of our economy and our environment.
“The need to improve London’s public transport capacity is desperate – hence the urgent necessity for Crossrail and more people could be encouraged to walk and cycle whenever possible.”
Road-user charging
In 2017, the Transport Committee report ‘London Stalling’ made a number of recommendations including: investigating the next generation of smart road-user charging.
Emeritus Professor Roger Vickerman from the School of Economics at the University of Kent also believes tackling congestion on UK roads requires innovative new ideas, chiefly a form of road pricing that charges for use rather than simply vehicle ownership.
“A year on from the report that UK drivers spend an average of 31 hours a year in traffic jams we now have evidence on the most congested roads in the UK,” said Vickerman. “This shows that although the worst trouble spots are in London the problem affects all our big cities.
“I have argued before that what is needed is a nationwide system of charging for roads by use – road pricing. But this would need to be embedded within a much more strategic rethink of how we provide the transport we need for our cities and towns.
“We already have blunt instruments such as the London Congestion Charge, but a sophisticated system of electronic tolling would charge drivers for their actual use of the system and by differentiating by the time of day can encourage those with the flexibility to adjust their journeys to times of lower traffic volumes.”
Vickerman believes that the current system of charging motorists is a tax on car purchase and ownership, and doesn’t distinguish by area of residence or actual use.
“Cars spend an average 95% of their life parked,” he said. “Residents of rural areas, many of whom have no alternative to using a car, typically travel on the least congested roads, but pay the same in road tax and fuel duty.
“Such drivers would be better off under a system which charged for the actual use of roads that reflected levels of congestion.
“The overall cost to road users would be less; the estimated average cost of that 31 hours of wasted time is £1168; that would pay for a lot of miles.
“The usual response is to call for more road building, and whilst that and junction improvements can help in some cases, the evidence suggests that traffic typically expands to fill the space available.
“But it is not just about cars competing for road space. Much of the increase in traffic in towns comes from van traffic – typically delivering our online purchas2es – we have to recognise that this too has a cost that will have to be paid for."
Eventually, as with any limited resource, Vickerman claims that the only solution is one that uses price as a means of allocation. “That’s how we charge for the alternatives such as bus, rail or air,” he said, “and if all modes of transport were priced on the same basis we could make a better-informed choice of the right one to use for each journey.
“This shows the need for a much more integrated approach to transport planning embracing new technologies both in the delivery of transport services and in paying for them. Politicians need to grasp this nettle now.”
Most Congested Urban Areas in the UK
|
2018 Impact Rank (2017) |
Urban Area |
Hours Lost in Congestion (Rank 2018) |
Year Over Year Change |
Intercity Last Mile-Travel Time (minutes) |
Intercity Last-Mile Speed (MPH) |
Cost of Congestion per Driver |
|
1 (1) |
London |
227 (1) |
1% |
8 |
7 |
£1,680 |
|
2 (2) |
Birmingham |
134 (12) |
-4% |
5 |
12 |
£994 |
|
3 (3) |
Glasgow |
99 (16) |
4% |
6 |
13 |
£736 |
|
4 (7) |
Manchester |
156 (4) |
2% |
6 |
10 |
£1,157 |
|
5 (5) |
Bristol |
149 (9) |
0% |
8 |
8 |
£1,099 |
|
6 (4) |
Edinburgh |
165 (3) |
10% |
8 |
7 |
£1,219 |
|
7 (8) |
Sheffield |
149 (8) |
1% |
6 |
10 |
£1,101 |
|
8 (9) |
Leicester |
155 (5) |
-4% |
6 |
11 |
£1,145 |
|
9 (10) |
Leeds |
143 (10) |
6% |
5 |
12 |
£1,057 |
|
10 (6) |
Liverpool |
119 (13) |
-16% |
6 |
9 |
£878 |
The Most Congested Corridors in the UK
The A406 from Chiswick Roundabout to Hanger Lane tops the Inrix list of worst corridors in UK, with the average driver wasting 61 hours per year in congestion. The A23, the Strand and Leeds Road and the A34 in Birmingham make up the top five.
20 Most Congested UK Roads in 2018
|
Rank |
City |
Road Name |
From |
To |
Daily Delay (Mins) |
Yearly Delay (Hrs) |
|
1 |
London |
A406|North Circular Road |
Chiswick Roundabout |
Hanger Lane |
15 |
61 |
|
2 |
London |
A23 |
Kennington |
Thornton Road |
14 |
56 |
|
3 |
London |
Kingsway|Strand|Fleet|Cannon Street |
Russell Square |
Monument |
12 |
49 |
|
4 |
Leeds |
Leeds Road|Saltaire Road |
Harrogate Road |
Bradford Road |
11 |
44 |
|
5 |
Birmingham |
A34|Stratford Road |
Highfield Road |
Highgate Middleway |
11 |
44 |
|
6 |
London |
A406|North Circular Road |
A1 |
A10 |
11 |
43 |
|
7 |
London |
A2103 |
Canary Warf |
Tower of London |
11 |
43 |
|
8 |
Birmingham |
A34|Stratford Road |
Highgate Middleway |
Highfield Road |
11 |
42 |
|
9 |
Leeds |
Huddersfield Road|Leeds Road |
Dewsbury |
Huddersfield |
10 |
40 |
|
10 |
Manchester |
Bury New Road |
Higher Broughton |
M60 |
9 |
34 |
|
11 |
Manchester |
Bramhall Lane South |
Bridge Lane |
Stockport |
8 |
33 |
|
12 |
Birmingham |
Dudley Port |
Black Country New Road |
Dudley |
8 |
32 |
|
13 |
Manchester |
Chapel|Crescent|Broad Street |
Victoria Bridge |
M60 |
8 |
32 |
|
14 |
Glasgow |
Great Western Road |
Kelvinside |
Bearsden Road |
8 |
31 |
|
15 |
Birmingham |
Soho Hill|Birmingham Road |
Icknield Street |
M5 |
8 |
30 |
10 Most Congested Cities in the World in 2018
|
2018 Impact Rank (2017) |
Urban Area |
Country |
Region |
Hours Lost in Congestion (Rank 2018) |
Year Over Year Change |
|
1 (1) |
Moscow |
Russia |
Europe |
210 (10 ) |
-12% |
|
2 (3) |
Istanbul |
Turkey |
Europe |
157 (32 ) |
6% |
|
3 (2) |
Bogota |
Colombia |
South America |
272 (1 ) |
-5% |
|
4 (4) |
Mexico City |
Mexico |
South America |
218 (9 ) |
3% |
|
5 (5) |
São Paulo |
Brazil |
South America |
154 (39 ) |
-1% |
|
6 (6) |
London |
U.K. |
Europe |
227 (6 ) |
1% |
|
7 (8) |
Rio de Janeiro |
Brazil |
South America |
199 (13 ) |
15% |
|
8 (7) |
Boston, MA |
United States |
North America |
164 (25 ) |
-6% |
|
9 (9) |
Saint Petersburg |
Russia |
Europe |
200 (12 ) |
-5% |
|
10 (13) |
Rome |
Italy |
Europe |
254 (2 ) |
16% |


Login to comment
Comments
No comments have been made yet.