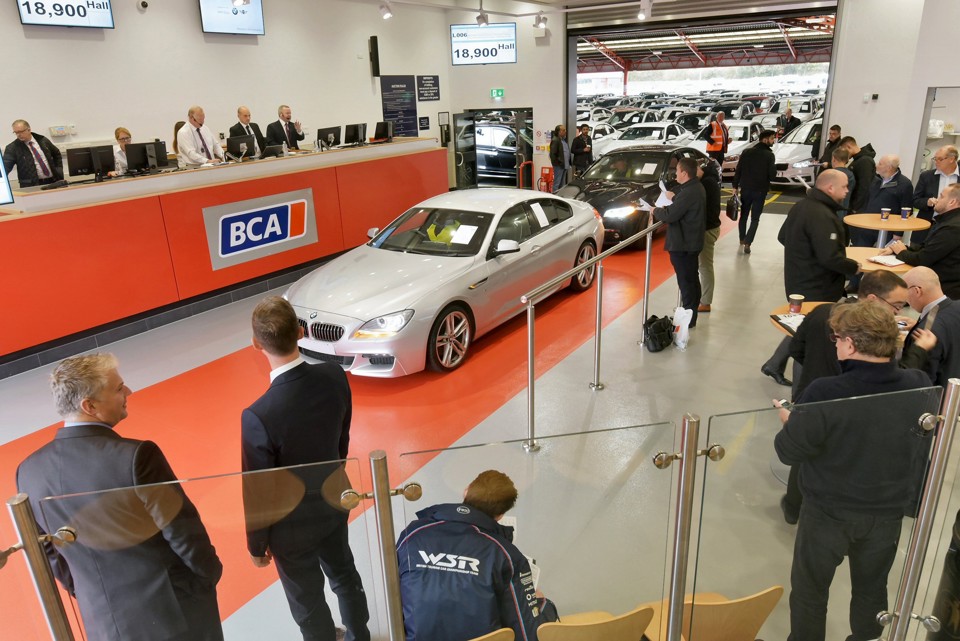
Used car values rose at BCA in March 2019, with average values for fleet and lease, dealer part-exchange and nearly-new vehicles all improving compared to the previous month’s figures, according to the latest BCA Pulse Report.
The headline figure fell back slightly with a changing model mix as a higher percentage of dealer part-exchange cars reached the market following the plate-change on March 1. Year-on-year, the headline value was marginally ahead by £25.
Stuart Pearson, chief operating officer at BCA UK Remarketing, said: “Demand continues in the market for accurately valued vehicles in the best condition and reflecting seasonal patterns, we’ve seen a lift in volume from both fleet/lease and dealer part-exchange sources.”
He continued: “The seasonal run of public Holidays over the Easter period and into May has the ability to put pressure on the market at a time where supply is typically plentiful.
“As ever, our advice is for vendors to be disciplined around the remarketing process with enhanced preparation, accurate descriptions, comprehensive documentation and, most importantly, realistic reserve setting ensuring that buyers remain actively engaged.”
Year-on-year table: All cars
|
All cars |
Avg Age |
Avg Mileage |
Avg Value |
|
Mar 2018 |
54.33 |
47,474 |
£9,668 |
|
Mar 2019 |
56.80 |
48,952 |
£9,693 |
Fleet and lease values averaged £11,546 at BCA in March 2019, a modest month-on-month increase for the second month running and well ahead by £424 (3.8%) compared to a year ago.
The retained value against original MRP (Manufacturers Retail Price) was down marginally at 44.09% compared to 2018. Average age at time of sale has risen slightly to 39.9 months, with average mileage of 39,381 down by 194 compared to a year ago.
Year-on-year table: Fleet and lease
|
Fleet/ Lease |
Avg Age (months) |
Avg Mileage |
Avg Value |
Sales vs MRP |
|
Mar 2018 |
38.86 |
39,575 |
£11,122 |
44.22% |
|
Mar 2019 |
39.91 |
39,381 |
£11,546 |
44.09% |
Dealer part-exchange values continued to rise at BCA, with March 2019 showing a £50 increase over February at £5,217. The improved quality of product on offer in this sector helped to push year-on-year values up by £322 (6.5%), with average age and mileage decreasing compared to the same month in 2018.
Year-on-year table: Dealer Part-Exchange
|
Part-Exchange |
Avg Age (months) |
Avg Mileage |
Avg Value |
|
Mar 2018 |
89.07 |
69,899 |
£4,895 |
|
Mar 2019 |
87.60 |
68,151 |
£5,217 |
Sustained demand for nearly-new vehicles at BCA continued into March, with values rising to £23,314 during the month. Values were up by £4,445 (23.5%) compared to the same month last year. Model mix has a significant effect in this low volume sector, with brand specific winners and losers.
Year-on-year table: Nearly New
|
Nearly new |
Avg Age (months) |
Avg Mileage |
Avg Value |
|
Mar 2018 |
8.77 |
8,934 |
£18,869 |
|
Mar 2019 |
8.63 |
8,394 |
£23,314 |


Login to comment
Comments
No comments have been made yet.