There were 2,386,780 speeding offences detected in England and Wales in 2018-19 – a 37% rise on the 1,740,217 speeding offences detected in 2011-12.
It was also 4% higher than the 2,292,534 speeding offences recorded in 2017-18.
The total number of all motoring offences detected across the two countries in 2018-19 was 2,837,661, meaning speeding accounted for 84% of them.
Of the 2,386,780 speeding offences detected in 2018-19:
- 44% resulted in the offender being sent on a speed awareness course.
- 34% attracted fixed penalty notices (FPNs).
- 12% were later cancelled.
- 10% resulted in court action.
The headline figure for those caught speeding hides large variations between constabularies.
The analysis – based on Home Office data and carried out by Dr Adam Snow of Liverpool John Moores University and Doreen Lam of the RAC Foundation – showed that West Yorkshire topped the list with 181,867 people caught speeding in 2018-19.
Second was Avon and Somerset (159,210) followed by the Metropolitan Police, including City of London (157,494).
At the other end of the scale Wiltshire Constabulary caught only 807 people speeding, Cleveland caught 11,937 and Derbyshire 12,256. Wiltshire turned off its speed cameras in 2010.
A full table is available below.
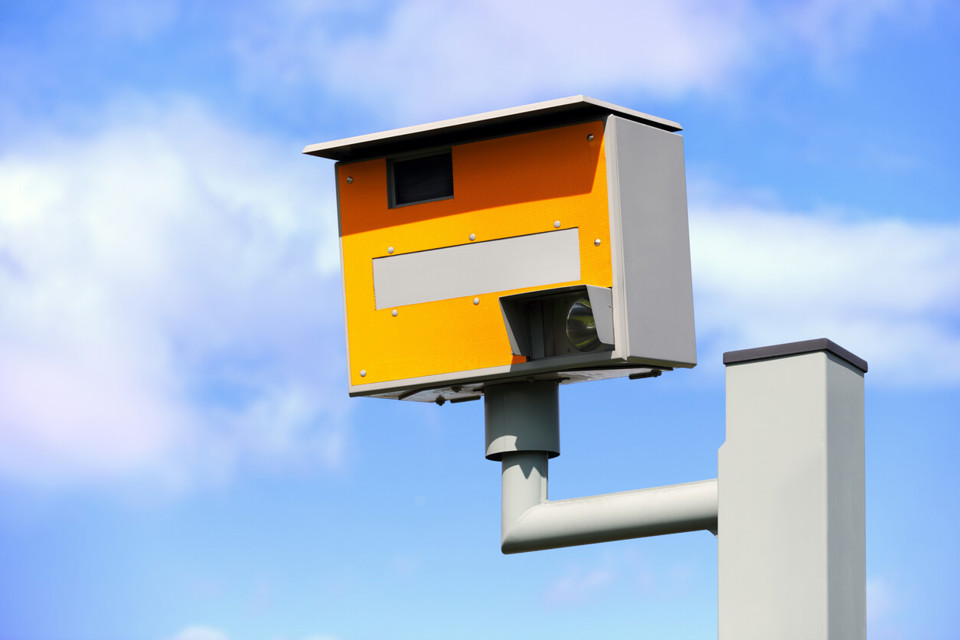
Across the 43 constabularies of England and Wales, the vast majority (97%) of offences were detected by speed cameras.
The variations across police forces will in part be down to geographical area, road type and traffic volume. They will also be created by local policing priorities. In Wiltshire, for example, all speed cameras were turned off in 2010.
Steve Gooding of the RAC Foundation said: “The simple rule for drivers who don’t want to risk ending up with a speeding ticket is not to break the limit in the first place.
“Where limits are properly signposted and clearly feel right for the road in question then motorists have no excuse for going faster, but that means highway authorities also have a responsibility to make sure the limits they set are appropriate and to avoid instances where the limit repeatedly ‘bounces’ up and down along a single stretch.”
In 2018, “exceeding the speed limit” was recorded as a contributory factor in 13% of fatal crashes in Great Britain where at least one factor was identified.
“Travelling too fast for the conditions” was a contributory factor in 9% of fatal crashes. More than one contributory factor might be recorded per incident.
Since the inception of the National Speed Awareness Course in 2010 about nine million people have attended one.
The RAC Foundation is a transport policy and research organisation that explores the economic, mobility, safety and environmental issues relating to roads and their users.
Detailed figures for all constabularies in England and Wales can be viewed here.
The table below gives summary information for individual forces.
Total number of speeding offences detected by police forces in England and Wales in 2018-19 and how they were detected.
|
Police Force Area |
Total number of speeding offences detected 2017-18 |
Total number of speeding offences detected 2018-19 |
% year-on-year change 2018-19 |
Proportion of speeding offences detected by camera 2018-2019 |
Total number of all motoring offences 2018-19 |
Proportion of speeding offences relative to all motoring offences 2018-19 |
|
Avon and Somerset |
199,336 |
159,210 |
-20% |
100% |
173,420 |
92% |
|
Bedfordshire |
74,297 |
76,573 |
3% |
100% |
80,685 |
95% |
|
Cambridgeshire |
45,763 |
34,672 |
-24% |
98% |
40,795 |
85% |
|
Cheshire |
58,408 |
52,770 |
-10% |
96% |
61,626 |
86% |
|
City of London/Metropolitan Police |
139,318 |
157,494 |
13% |
91% |
274,744 |
57% |
|
Cleveland |
11,308 |
11,937 |
6% |
97% |
13,592 |
88% |
|
Cumbria |
45,702 |
40,104 |
-12% |
99% |
42,331 |
95% |
|
Derbyshire |
10,480 |
12,256 |
17% |
98% |
14,736 |
83% |
|
Devon and Cornwall |
42,888 |
47,272 |
10% |
98% |
52,152 |
91% |
|
Dorset |
23,027 |
22,716 |
-1% |
94% |
26,391 |
86% |
|
Durham |
8,802 |
19,395 |
120% |
95% |
20,764 |
93% |
|
Essex |
95,967 |
91,849 |
-4% |
94% |
124,923 |
74% |
|
Gloucestershire |
21,727 |
24,121 |
11% |
99% |
25,729 |
94% |
|
Greater Manchester |
101,421 |
106,839 |
5% |
99% |
122,411 |
87% |
|
Hampshire |
79,126 |
73,036 |
-8% |
96% |
81,149 |
90% |
|
Hertfordshire |
51,158 |
52,794 |
3% |
98% |
61,763 |
85% |
|
Humberside |
57,930 |
53,679 |
-7% |
96% |
63,004 |
85% |
|
Kent |
18,878 |
20,366 |
8% |
95% |
30,024 |
68% |
|
Lancashire |
61,242 |
74,286 |
21% |
99% |
85,293 |
87% |
|
Leicestershire |
37,340 |
41,909 |
12% |
99% |
50,826 |
82% |
|
Lincolnshire |
47,020 |
45,712 |
-3% |
98% |
48,611 |
94% |
|
Police Force Area |
Total number of speeding offences detected 2017-18 |
Total number of speeding offences detected 2018-19 |
% year-on-year change 2018-19 |
Proportion of speeding offences detected by camera 2018-2019 |
Total number of all motoring offences 2018-19 |
Proportion of speeding offences relative to all motoring offences 2018-19 |
|
Merseyside |
60,681 |
53,112 |
-12% |
86% |
75,962 |
70% |
|
Norfolk and Suffolk |
92,750 |
98,729 |
6% |
96% |
114,957 |
86% |
|
North Wales |
20,462 |
19,493 |
-5% |
90% |
24,610 |
79% |
|
North Yorkshire |
29,922 |
41,934 |
40% |
99% |
47,421 |
88% |
|
Northamptonshire |
47,860 |
49,448 |
3% |
100% |
56,800 |
87% |
|
Northumbria |
66,327 |
67,857 |
2% |
99% |
75,961 |
89% |
|
Nottinghamshire |
27,155 |
24,566 |
-10% |
99% |
30,845 |
80% |
|
Wales (except North Wales) |
43,425 |
35,005 |
-19% |
96% |
49,934 |
70% |
|
South Yorkshire |
47,811 |
55,461 |
16% |
99% |
63,162 |
88% |
|
Staffordshire |
41,392 |
48,583 |
17% |
98% |
54,771 |
89% |
|
Surrey |
74,163 |
89,079 |
20% |
100% |
98,427 |
91% |
|
Sussex |
56,828 |
54,139 |
-5% |
98% |
62,202 |
87% |
|
Thames Valley |
131,400 |
145,447 |
11% |
98% |
158,854 |
92% |
|
Warwickshire |
43,409 |
52,774 |
22% |
99% |
58,612 |
90% |
|
West Mercia |
66,858 |
92,335 |
38% |
99% |
98,161 |
94% |
|
West Midlands |
34,966 |
57,154 |
63% |
93% |
67,457 |
85% |
|
West Yorkshire |
174,796 |
181,867 |
4% |
99% |
201,548 |
90% |
|
Wiltshire |
1,191 |
807 |
-32% |
0% |
3,008 |
27% |
|
Total England and Wales |
2,292,534 |
2,386,780 |
4% |
97% |
2,837,661 |
84% |


Login to comment
Comments
No comments have been made yet.