The latest transport data shows a "worrying" increase in road traffic, according to Dr Yvonne Doyle, medical director at Public Health England.
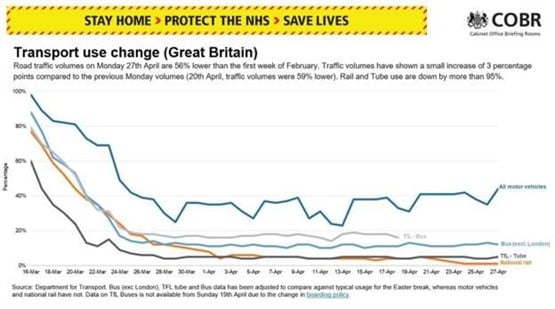
Publishing the latest transport use statistics for the UK at the daily Government news briefing yesterday (Wednesday, April 29), it shows that the number of vehicles was 56% lower on Monday (April 27) lower than in the first week February.
However, it had risen by 3% compared to the previous Monday and is almost 10% higher than it was at the end of the first week of lockdown on Monday, March 30.
Doyle said: “There has been an uptick in motor vehicles, and the message here really is that we are still passing through this peak.
“We really have to be vigilant. Most people are making huge efforts to stay at home and save lives.
“This is slightly worrying, so please do stay at home, protect the NHS, save lives. Go out for the necessities.”

Separate data from the RAC appears to confirm Doyle’s concerns, with analysis of hundreds of thousands of RAC Insurance black box trips showing the number of vehicles on the UK’s roads is rising.
RAC Insurance spokesman Simon Williams said: “By the second week of the lockdown our data clearly showed the volume of vehicles being driven had fallen by 40%, but by the end of last week, this crept back up again by 10%. The number of separate trips being made by car has also risen by 14% since the beginning of April.
“With the lockdown still very much in force, it remains the case that none of us should be driving unless it’s for an essential trip.
“The fact we are now several weeks into the lockdown must not be used as an excuse to change our behaviour and venture out unnecessarily – our data seems to suggest some people may be finding more reasons to be on the road than earlier in April.”
Since the lockdown was announced on March 23, car leasing firm Leasing Options has been using Google Maps to monitor traffic in cities in the UK and Ireland.
Google Maps works by using historical information, plus real-time data from our smartphones, allowing us to see typical road traffic from before and after the coronavirus restrictions were put in place.
Leasing Options recorded traffic from 8:30-8:40am, which is peak travel time for many commuters.
The results show that most Brits are staying safe, with a dramatic decrease in road traffic across the UK and Ireland.
|
City |
% Decrease in Traffic |
|
London |
77.61% |
|
Birmingham |
81.03% |
|
Liverpool |
74.07% |
|
Dublin |
83.16% |
|
Edinburgh |
77.27% |
|
Cardiff |
83.07% |
|
Manchester |
82.60% |
|
Belfast |
83.52% |
|
Newcastle |
80.36% |
You can find the data for London, Birmingham, Liverpool, Dublin, Edinburgh, Cardiff, Manchester, Belfast, and Newcastle from Leasing Options by clicking here.
One beneficiary of the dramatic decline in traffic is air quality. Instant Offices has collected data and ranked the top 13 UK cities with the most significant drop and rise in air pollution two weeks into lockdown.
The most dangerous air quality indicator PM2.5 levels has fallen in 13 of the UKs largest cities, with London showing the biggest drop by 34.29%, followed by Leicester (20.88%) and Edinburgh (16.89%).
While most cities saw dangerous particulate matter decline as human activity slowed down across the UK, Liverpool stands out with a huge 19.15% increase, followed by Birmingham with an increase of 9%.
Edward Harbison, corporate marketing manager at Instant Offices, said: “The significant reduction of PM2.5 across major cities in only two weeks of lockdown, is evidence of the staggering impact we have on the world around us.
“With reduced human activity across the board, our analysis showed a significant improvement in some of the worlds most polluted cities.
“Considering the impact that PM2.5 has on air quality and our overall health, this is especially noteworthy.”
For more information on the analysis that Instant Offices collected around the top cities with the largest improvements in air quality after two weeks of lockdown, click here.


Gordy - 30/04/2020 12:43
What are the theories/ reasons for the areas that have seen an increase in emissions readings since lockdown?