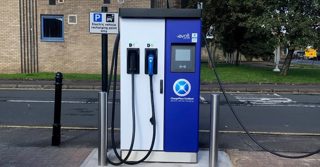
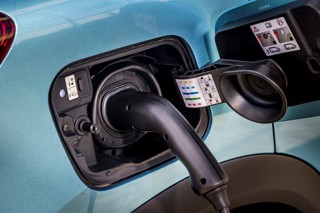
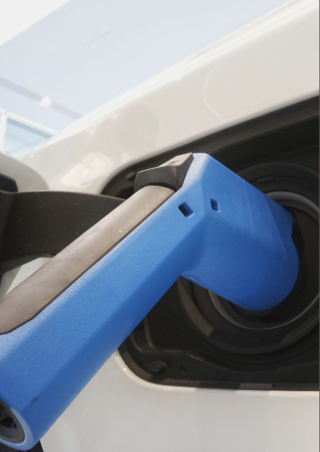
Westminster has been identified as the best place in the UK to drive an electric vehicle (EV) with regards to the availability of charging infrastructure.
It was revealed as part of a new study by CarFinance247, which has ranked the 20 best and 10 worst places to drive an EV based on data from the Department for Transport that details the number of charging points per 100,000 residents in each UK local authority
London boroughs and Scottish authorities dominate the list, along with EV frontrunners such as Milton Keynes, Coventry, and Brighton & Hove. Meanwhile, the Isles of Scilly top the ‘worst’ list, with no EV chargers. The full lists can be found below.
As of October 1, 2021, there were 25,927 public EV charging devices across the UK (of which 4,923 were rapid chargers). The number of devices has increased by 6% on the previous quarter and, since 2015, the number of public devices has grown by 9%.
Louis Rix, COO and co-founder of CarFinance 247 said: “For some time now, London and Scotland have been way ahead of the game in terms of building a successful network of EV charging devices in their respective regions.
“The dark horses that have crept into the top 10 include Milton Keynes and Coventry. Their development outshines other areas of the country, with Coventry recently powering ahead to get as many EVs on the road as possible to drastically reduce the city’s use of petrol and diesel cars.
“There is, however, a significant amount still to be done before the UK can eliminate petrol and diesel-fuelled cars completely. The number of public chargers must increase into the hundreds across most parts of the UK. Considering that Westminster – one of the wealthiest areas in the country – has roughly 400 chargers per 100,000 residents, we’ll need to see areas reaching the same ratio to avoid energy crises in future.”
Top 20 places to drive an EV:
|
Rank |
Local Authority |
Public Charging Devices |
Devices per 100,000 people |
|
1 |
Westminster |
1095 |
405.8 |
|
2 |
Kensington & Chelsea |
547 |
348.7 |
|
3 |
City of London |
36 |
329.1 |
|
4 |
Hammersmith & Fulham |
580 |
316.0 |
|
5 |
Wandsworth |
623 |
188.9 |
|
6 |
Richmond Upon Thames |
354 |
178.7 |
|
7 |
Orkney Islands |
40 |
178.6 |
|
8 |
Milton Keynes |
372 |
137.7 |
|
9 |
Camden |
373 |
133.4 |
|
10 |
Coventry |
481 |
126.8 |
|
11 |
Stirling |
115 |
122.2 |
|
12 |
Southwark |
390 |
121.9 |
|
13 |
Brighton & Hove |
345 |
118.3 |
|
14 |
Islington |
286 |
115.3 |
|
15 |
East Lothian |
123 |
114.0 |
|
16 |
Na h-Eileanan Siar |
28 |
105.7 |
|
17 |
Hounslow |
282 |
103.8 |
|
18 |
Argyll & Bute |
86 |
100.7 |
|
19 |
Merton |
199 |
96.4 |
|
20 |
Lambeth |
307 |
95.4 |
10 worst places to drive an EV:
|
Rank |
Local Authority |
Public Charging Devices |
Devices per 100,000 people |
|
1 |
Isles of Scilly |
0 |
0.0 |
|
2 |
Castle Point |
3 |
3.3 |
|
3 |
Fenland |
5 |
4.9 |
|
4 |
Medway |
17 |
6.1 |
|
= 5 |
Rhondda Cynon Taf |
18 |
7.4 |
|
= 5 |
Wirral |
24 |
7.4 |
|
= 7 |
Bolton |
24 |
8.3 |
|
= 7 |
Neath Port Talbot |
12 |
8.3 |
|
9 |
Walsall |
24 |
8.4 |
|
10 |
Southend-on-Sea |
16 |
8.8 |


Login to comment
Comments
No comments have been made yet.