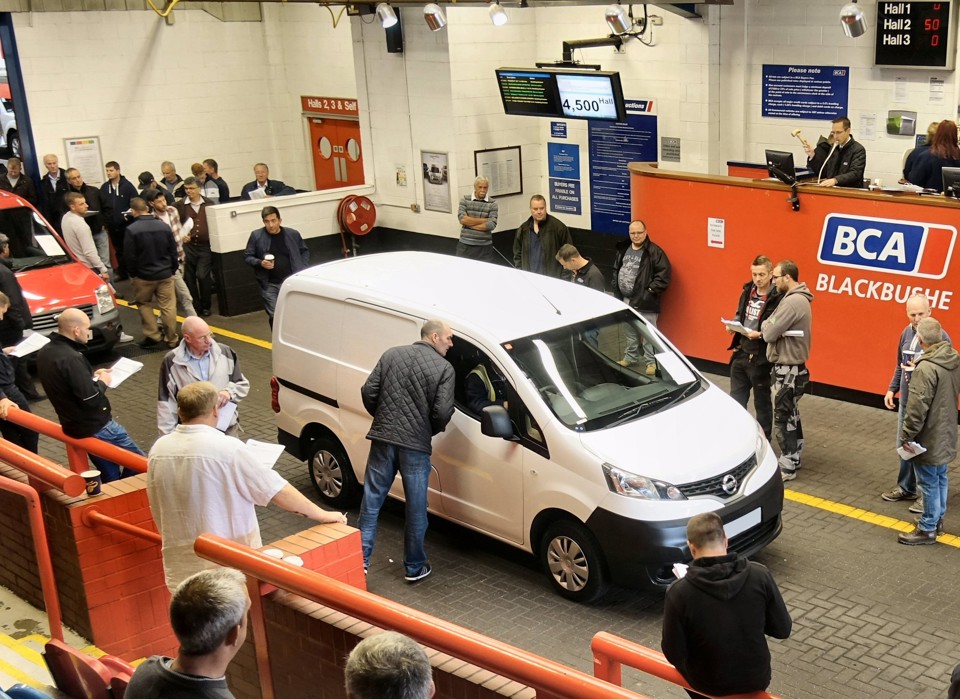
After three consecutive record months, average LCV values fell in May, but remain at near record levels, reports BCA.
Average values fell by £70 (0.9%) to £7,502, although this is the second highest figure on record at BCA. Year-on-year, average values remain ahead by a significant amount, up by £1,050 (16.2%). Both mileage and age continued to fall compared to a year ago.
Fleet/lease and dealer part-exchange values fell, month-on-month, but nearly-new values continued to climb, rising for the fourth month running.
Year-on-year table: All vans
|
All vans |
Avg Age (mnths) |
Avg Mileage |
Avg Value |
|
May 2017 |
50.28 |
66,291 |
£6,452 |
|
May 2018 |
49.27 |
65,629 |
£7,502 |
BCA chief operating officer for UK remarketing, Stuart Pearson, said: “Demand for good quality LCV stock in ready-to-retail condition continues is outstrip supply across the BCA network, and professional buyers are competing strongly whether they buy physically in-lane or digitally via BCA Live Online.
“Despite the approaching summer holiday season, trading levels remain good and professional buyers remain very active.”
He continued: “The LCV market is less prone to the seasonal adjustments that traditionally occur in the car market, partly driven by different levels of supply but also by the nature of purchasing.
“We continue to see plenty of interest in panel vans to serve the home delivery sector and high levels of demand for vehicles suitable for work in the construction and building trades.”
Fleet and lease LCV values fell back by £108 (1.2%) to £8,378 in May, although values remain at near record levels and significantly ahead of the same period last year. Retained value against MRP (Manufacturer Recommended Price) increased marginally to 40.82%.
Compared to May 2017, the year-on-year differential for fleet and lease vans is a substantial £1,199 (16.7%), with average age falling by one month and mileage over 2,400 lower. Both these latter factors will have contributed to the significant price evolution in the past year.
Year-on-year table: Fleet and lease vans
|
Fleet/Lease |
Avg Age (mnths) |
Avg Mileage |
Avg Value |
Sale vs MRP |
|
May 2017 |
39.30 |
59,785 |
£7,179 |
36.58% |
|
May 2018 |
38.44 |
57,339 |
£8,378 |
40.82% |
Average part-exchange LCV values fell back by £37 (0.8%) to £4,391 in May 2018. Values have been relatively stable for much of this year and have moved by less than 1% since February. Values were up by £246 (5.9%) compared to May 2017, with comparative age and mileage rising over the period.
Year-on-year table: Part-Ex vans
|
Part-Ex |
Avg Age (mnths) |
Avg Mileage |
Avg Value |
|
May 2017 |
78.81 |
86,535 |
£4,145 |
|
May 2018 |
81.23 |
92,131 |
£4,391 |
Nearly-new LCV values rose to £17,048 in May, a £900 (5.5%) increase and the fourth consecutive monthly rise. Year-on-year, average nearly-new values are over £4,000 ahead although this has to be taken in the context of the very low volumes reaching the market and the model mix factor.
Year-on-year table: Nearly-new vans
|
Nearly-new |
Avg Age (mnths) |
Avg Mileage |
Avg Value |
|
May 2017 |
9.40 |
11,139 |
£13,027 |
|
May 2018 |
8.65 |
10,334 |
£17,048 |


Login to comment
Comments
No comments have been made yet.