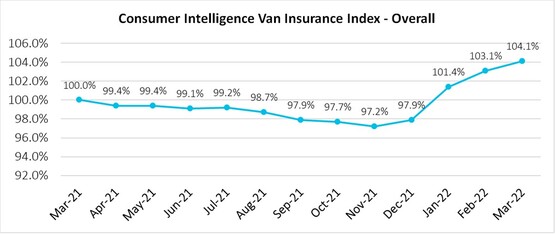
Van insurance is up 6.3% since the start of the year, as a result of new FCA ‘price walking’ rules that came into force in January.
Recent research from data company, Consumer Intelligence, has found that the FCA’s general pricing rules, which were introduced to put an end to ‘price walking’, have pushed premiums up by 6.3% in the three months to March.
Since January, insurers have not been able to offer new customers low premiums to win their business – with renewing customers only allowed access to the same deals as a new customer.
Data from Consumer Intelligence said this is reducing the number of cheap deals in the market.
Average premiums have increased 40.2% since April 2014 when Consumer Intelligence first started collecting data - an average annual van policy in the UK currently stands at £1,135.
 The bulk of the rises have come from van drivers aged 25-49 and the over-50s, who’ve seen 60.1% and 55.6% price hikes, respectively – whereas the under-25s have witnessed price falls in the region of 23.8% over the same period.
Drivers using their vans for business (£1,145) continue to pay slightly higher premiums than those who use their vans as a car substitute (£1,107) under a social, domestic and pleasure (SDP) policy.
Business users have also seen their motor premiums increase 6.8% in the last three months, with premiums rising just 5.0% for those using their vans as a car substitute.
All age groups have recorded similar premium rises in the last three months – with van drivers aged 25-49 (6.4%) seeing prices increase slightly more than for those aged 17-24 (5.9%) and the over-50s (5.7%).
A typical annual policy for a younger van driver under the age of 25 remains high at £3,936, the data company said.
For those aged 25-49 an annual premium is now, on average, £835. While for the over-50s, an annual policy costs just £562.
|
Consumer Intelligence Van Insurance Index - Overall |
Date range |
Overall |
Age 17-24 |
Age 25-49 |
Age 50+ |
Carriage of own goods |
SDP |
|
All months |
Apr 2014 to Mar 2022 |
40.2% |
-23.8% |
60.1% |
55.6% |
39.9% |
42.4% |
|
Last year |
Mar 2021 to Mar 2022 |
4.1% |
-5.7% |
5.9% |
3.9% |
3.9% |
4.5% |
|
Last 6 months |
Sep 2021 to Mar 2022 |
6.3% |
4.1% |
6.9% |
5.2% |
6.2% |
6.5% |
|
Last 3 months |
Dec 2021 to Mar 2022 |
6.3% |
5.9% |
6.4% |
5.7% |
6.8% |
5.0% |
|
Year to date |
Dec 2021 to Mar 2022 |
6.3% |
5.9% |
6.4% |
5.7% |
6.8% |
5.0% |
|
Segment as proportion of batch (Mar 2022) |
100% |
12% |
66% |
22% |
75% |
25% |
|


Login to comment
Comments
No comments have been made yet.