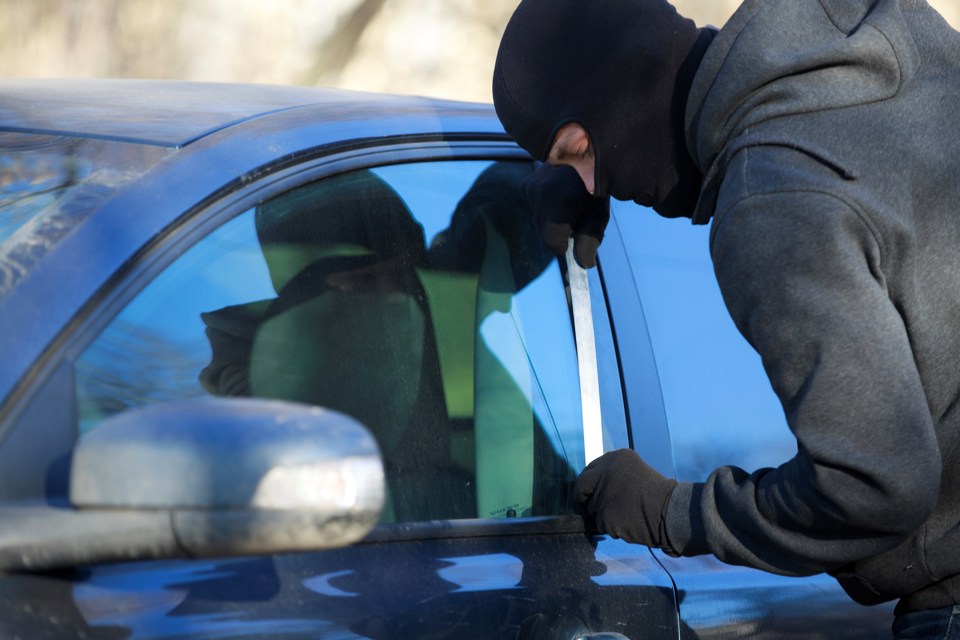
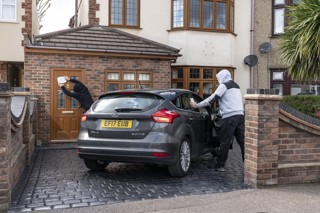
The postcode CR0 (Croydon), has the highest volume of vehicle crime, with 6,005 recorded crimes over the past three years, an average of five every day, or 39 for every 1,000 residents.
That’s according to new research by Direct Line Motor Insurance, which shows the UK postcodes with the highest rates of vehicle crime.
In the research, Croydon ranks ahead of NW10 (Brent), N17 (Haringey), E17 (Waltham Forest) and NW2 (Barnet), with the highest-ranking non-London postcode being LE3 (Leicester) in seventh place.
The company said vehicle crime is a broad definition used by police forces that defines illegal activity such as theft of a motor vehicle, theft from a motor vehicle, aggravated vehicle taking and interference with a motor vehicle.
Lorraine Price, head of motor insurance at Direct Line, said: “It is troubling to see the scale of vehicle crime across the UK.
“These are not isolated incidents; every year thousands of cars are stolen, or damaged as criminals break in to take items left in them.
“No matter where you live in the UK, it is important to be vigilant. Simple steps such as ensuring your car is double locked and parked in a well-lit area may help deter a criminal.”
The B40 postcode in Solihull, West Midlands, had the highest proportion of vehicle crime as a percentage of all recorded crime over the past three years. Almost a quarter (24%) of all crimes in the area related to vehicles.
On a regional level, London dominates the worst areas for vehicle crime, with nearly 10% of all crimes recorded in the capital involving a vehicle. This amounts to more than 321,000 crimes over the past three years, or 293 every day.
The next highest area, the West Midlands, has seen less than half the amount of vehicle crime as London. Meanwhile the safest region for vehicle crime is Northern Ireland, with only 4.6 crimes per 1,000 people.
Direct Line has partnered with the University of Huddersfield for its ‘Truth about Car Theft’ campaign, which includes academic research amongst prolific car thieves to understand the motive, means and opportunities for vehicle crime, to help motorists reduce the risk of falling victim to these criminals.
Professor Rachel Armitage, professor of criminology at the University of Huddersfield, said: “Our research shows car owners need to be vigilant, but there are steps they can take to help protect their vehicles.
“Signs warning of the presence of dogs, gravel driveways and wingmirrors being turned in were all repeatedly mentioned as deterrents when conducting the research.
“Although most cars come with sophisticated security measures, criminals often research how to get round them and share intelligence amongst the offender community.
“Simple measures, such as keeping keys out of view, could really make a difference and reduce how appealing a car looks to a criminal.”
Looking specifically at car theft internationally, the UK ranks among the highest in the world, with the 14th highest rate of incidents.
With an average of 190 thefts per 100,000 people, it ranks above the likes of France, Iran, Puerto Rico, Brazil, and Mexico.
Direct Line said it is significantly higher than the estimated worldwide car-theft rate of 85 per 100,000 residents. The total of 126,516 cars stolen a year means that the UK experiences an average of 347 car thefts a day.
The company also said similarly, to overall vehicle crime, car theft is not distributed evenly throughout the UK, as England and Wales have a higher rate of car theft than the rest of the country, with 203 thefts per 100,000 people compared to 77 in Northern Ireland and 91 in Scotland.
The AA recently renewed its keyless entry theft warning as half of drivers take no action to protect their keys.
Vehicle crime by postcode (2019-2021)
|
Postcode (Local Authority) |
Total number of vehicle crimes |
Total Crime & Antisocial Behaviour |
Vehicle crime as a proportion of all crime |
Vehicle crimes per 1,000 people |
|
CR0 (Croydon) |
6,005 |
63,841 |
9.4 per cent |
39.0 |
|
(NW10) Brent |
5,092 |
45,443 |
11.2 per cent |
55.4 |
|
(N17) Haringey |
4,707 |
35,148 |
13.4 per cent |
74.8 |
|
(E17) Waltham Forest |
3,958 |
41,084 |
9.6 per cent |
38.3 |
|
(NW2) Barnet |
3,703 |
27,147 |
13.6 per cent |
54.8 |
|
(E14) Tower Hamlets |
3,553 |
42,358 |
8.4 per cent |
43.0 |
|
(LE3) Leicester |
3,543 |
41,854 |
8.5 per cent |
35.0 |
|
(N1) Hackney |
3,430 |
49,259 |
7.0 per cent |
37.7 |
|
(E40) Waltham Forest |
3,211 |
19,911 |
16.1 per cent |
53.3 |
|
(IG1) Redbridge |
2,969 |
32,080 |
9.3 per cent |
46.7 |
Vehicle crime by region (2019-2021)
|
Region |
Total number of vehicle crimes |
Total Crime & Antisocial Behaviour |
Vehicle crime as a proportion of all crime |
Vehicle crimes per 1,000 people |
|
London |
321,008 |
3,339,887 |
9.6 per cent |
38.8 |
|
West Midlands |
112,059 |
1,649,287 |
6.8 per cent |
19.9 |
|
East of England |
105,438 |
1,763,031 |
6.0 per cent |
17.6 |
|
South East |
140,789 |
2,474,465 |
5.7 per cent |
16.1 |
|
East Midlands |
73,124 |
1,423,986 |
5.1 per cent |
16.9 |
|
Yorkshire and the Humber |
102,489 |
2,012,045 |
5.1 per cent |
18.9 |
|
South West |
59,154 |
1,352,259 |
4.4 per cent |
11.6 |
|
Wales |
36,831 |
980,875 |
3.8 per cent |
12.1 |
|
North East |
37,153 |
1,029,903 |
3.6 per cent |
15.1 |
|
North West |
70,123 |
1,735,170 |
4.0 per cent |
9.9 |
|
Northern Ireland |
8,216 |
481,867 |
1.7 per cent |
4.6 |


Login to comment
Comments
No comments have been made yet.