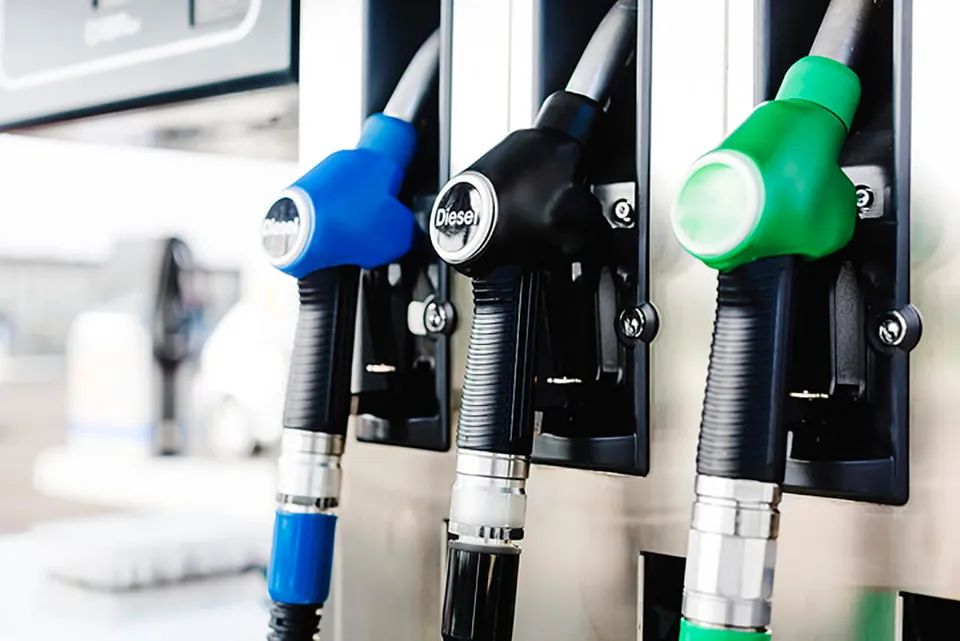
Average prices charged at the pumps of the UK’s four biggest supermarkets increased every day until a cut was finally announced at the end of the month, despite the wholesale cost of petrol and diesel falling in January.
The wholesale price of unleaded fell by more than 4p (4.23p), and diesel by 7.5p, across the month, dropping from 97.22p – before delivery, retailer margin and VAT – at the start of January to 92.98p at the end. Diesel went from 102.26p to 94.74p.
This should have led to a price reduction at the pumps during January, but instead retailers put their prices up leading to the second consecutive monthly rise of both fuels.
The average UK price of petrol now stands at 127.60p – up a penny (0.92p) from the beginning of January (126.68p). Diesel also increased by a penny (0.96p) to 132.04p from 131.08p. At the supermarkets, however, unleaded averages 123.69p (up 1.51p) and diesel 128.14p (up 1.30p).
Wholesale petrol averaged 96.57p a litre over the month, and diesel 100.19p, with both dropping sharply towards the end of January as a result of oil going below $60 a barrel for the first time since the end of October.
A barrel of crude closed out the month at $56.59 – the lowest price since August 8 2019 – due to the impact of the coronavirus outbreak on global demand for oil.
Comparing the average wholesale price of petrol to the average pump price throughout January (127.82p) means delivery, retailer margin and VAT accounts for 31.82p.
Of this, VAT equates to around 21p, delivery at 2p a litre, which means retailer margin is around 9p a litre – 4p more than it has averaged since 2013.
The cost of filling up a 55-litre family car with either fuel is now 50p a tank more expensive than December: petrol is now £70.18 – and £72.62 for diesel.
RAC fuel spokesman Simon Williams said: “Based on steadily falling wholesale prices January should have been a good month for drivers at the pumps, but instead they ended up being paying well over the odds at the pumps. In fact, January was a perfect example of ‘rocket and feather’ pricing where prices go up far faster than they come down.
“Retailers were very quick to protect themselves from a slight jump in the price of oil caused by the tensions between Iran and the US at the start of January by putting up forecourt prices, but when the cost of a barrel dropped back, for some reason, retail prices carried on going up.
“Our biggest retailers – the supermarkets – blatantly resisted passing on the savings they were making to drivers until the RAC publicly called on them to do so on 27 January when RAC Fuel Watch data showed there was scope for a large cut. Two days later a headline-grabbing 3p a litre cut was announced.
“This was clearly good news, but it’s hard to congratulate retailers on doing something they should have done at least a week before.
“Even since the cut pump prices are still out of kilter with what’s been happening on the wholesale market. As things stand now – despite the cuts – petrol is still 5p too expensive and diesel over 7p too dear.”
The RAC is urging retailers of all sizes to “play fair” with drivers and cut their forecourt prices.
Going forwards it is calling on them to charge prices that more closely mirror drops in the cost they buy fuel in at in the same way they do when prices go up.
“Sadly however, drivers are at the mercy of fuel retailers and this generally means they lose out on getting a fair deal,” said Williams.
Regional fuel price variation
Regional average unleaded pump prices
|
Unleaded |
02/01/2020 |
30/01/2020 |
Change |
|
UK average |
05/05/1900 |
06/05/1900 |
0.92 |
|
Northern Ireland |
123.83 |
125.62 |
1.79 |
|
North East |
124.52 |
126.25 |
1.73 |
|
Wales |
125.29 |
126.87 |
1.58 |
|
Yorkshire And The Humber |
125.57 |
126.71 |
1.14 |
|
Scotland |
125.76 |
126.88 |
1.12 |
|
East |
126.82 |
127.87 |
1.05 |
|
South West |
126.35 |
127.38 |
1.03 |
|
East Midlands |
126.40 |
127.40 |
1.00 |
|
West Midlands |
126.81 |
127.52 |
0.71 |
|
South East |
127.73 |
128.40 |
0.67 |
|
London |
127.74 |
128.26 |
0.52 |
|
North West |
126.92 |
126.78 |
-0.14 |
Regional average diesel pump prices
|
Diesel |
02/01/2020 |
30/01/2020 |
Change |
|
UK average |
131.08 |
132.04 |
0.96 |
|
Wales |
130.07 |
131.63 |
1.56 |
|
Scotland |
130.46 |
131.87 |
1.41 |
|
Northern Ireland |
128.02 |
129.27 |
1.25 |
|
North East |
129.42 |
130.62 |
1.20 |
|
South West |
130.90 |
132.08 |
1.18 |
|
Yorkshire And The Humber |
130.04 |
131.15 |
1.11 |
|
East |
131.56 |
132.49 |
0.93 |
|
East Midlands |
130.97 |
131.88 |
0.91 |
|
South East |
132.08 |
132.96 |
0.88 |
|
West Midlands |
130.83 |
131.70 |
0.87 |
|
London |
131.52 |
132.27 |
0.75 |
|
North West |
130.52 |
131.22 |
0.70 |


Login to comment
Comments
No comments have been made yet.