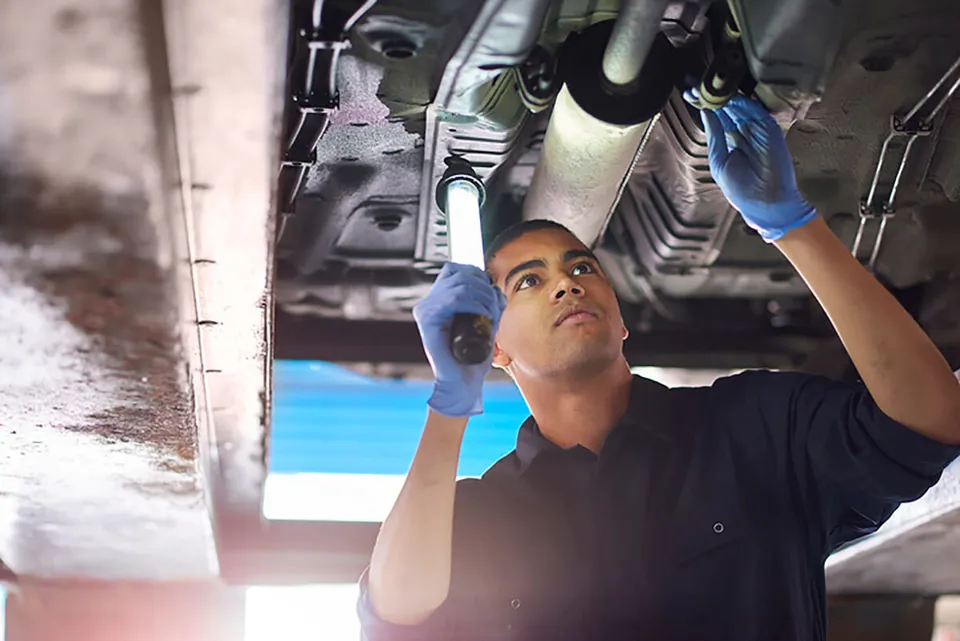
New data from the Driver and Vehicle Standards Agency (DVSA) shows how the annual test is keeping dangerous vehicles off UK roads.
More than 23,000 potentially dangerous lorries, trailers and public service vehicles (PSVs) were taken off the road or repaired between April and June 2019, the new DVSA data reveals. This represents 11.8% of the tests taken.
The data shows that there was a total of 198,381 annual tests for these types of vehicle, including (failure rate):
- 111,911 HGVs (13.3%)
- 19,374 PSVs (11.8%)
- 67,096 trailers (9.4%)
Hugh Rimmer, DVSA’s vehicle testing task force lead, said: “DVSA’s priority is helping everyone keep their vehicle safe to drive. This data shows the huge contribution that the annual test makes to keeping Britain’s roads amongst the safest in the world.
“Although the failure rate of 11.8% is far lower than that of cars, 32.5% of which failed their MOT in the same period, it is still too high.
“Heavy vehicles are subject to a strict maintenance regime and should also be subject to a daily walk around test. Operators should ensure that their vehicles remain safe to drive the whole year round and that they’re properly prepared for the annual test.”
As well as identifying and removing potentially dangerous vehicles from UK roads, the annual test has also made a significant contribution to air quality. More than 1,000 (1,007, 0.9% of vehicles tested) failed their test on emissions and were not allowed back on the road until the problem was resolved.
In the same period, DVSA allocated 152,000 testing hours to Authorised Testing Facilities (ATFs). They used 140,500 hours of this, representing an average utilisation rate of 93.58%.
Each year, around one million annual tests are carried out in Great Britain. The data in this release covers the period April – June 2019.
|
|
|
|
|
Top ten reasons for HGV motor vehicle fails |
|
|
|
Testable Item |
2019/20 Q1 |
|
|
Lamps |
3.2% |
|
|
Headlamp Aim |
3.0% |
|
|
Brake System Components |
2.4% |
|
|
Service Brake Performance |
1.7% |
|
|
Steering Mechanism |
1.5% |
|
|
Exhaust Emissions |
0.9% |
|
|
Parking Brake Performance |
|
|
|
Tyre condition |
0.8% |
|
|
Wiring |
|
|
|
Hazard Warning |
0.6% |
|
|
|
|
|
|
Top ten reasons for HGV trailer fails |
|
|
|
Testable Item |
2019/20 Q1 |
|
|
Service Brake Performance |
3.7% |
|
|
Parking Brake Performance |
2.3% |
|
|
Lamps |
1.6% |
|
|
Brake System Components |
1.5% |
|
|
Suspension |
1.1% |
|
|
Reflectors & Rear Markings |
0.6% |
|
|
Spray suppression, wings / wheel arches |
0.5% |
|
|
Tyres (Condition) |
0.5% |
|
|
Bumpers/Sguards |
0.2% |
|
|
Service Brake Operation |
0.2% |
|
|
Top ten reasons for PSV fails |
|
|
|
Testable Item |
2019/20 Q1 |
|
|
Headlamp Aim |
2.2% |
|
|
Lamps |
2.3% |
|
|
Brake System Components |
1.9% |
|
|
Doors and Emergency Exits |
1.7% |
|
|
Body (Interior) |
1.5% |
|
|
Seat Belts |
1.1% |
|
|
Suspension |
1.2% |
|
|
Parking Brake |
0.9% |
|
|
Service Brake Performance |
1.0% |
|
|
Steering Mechanism |
1.0% |
|


Login to comment
Comments
No comments have been made yet.